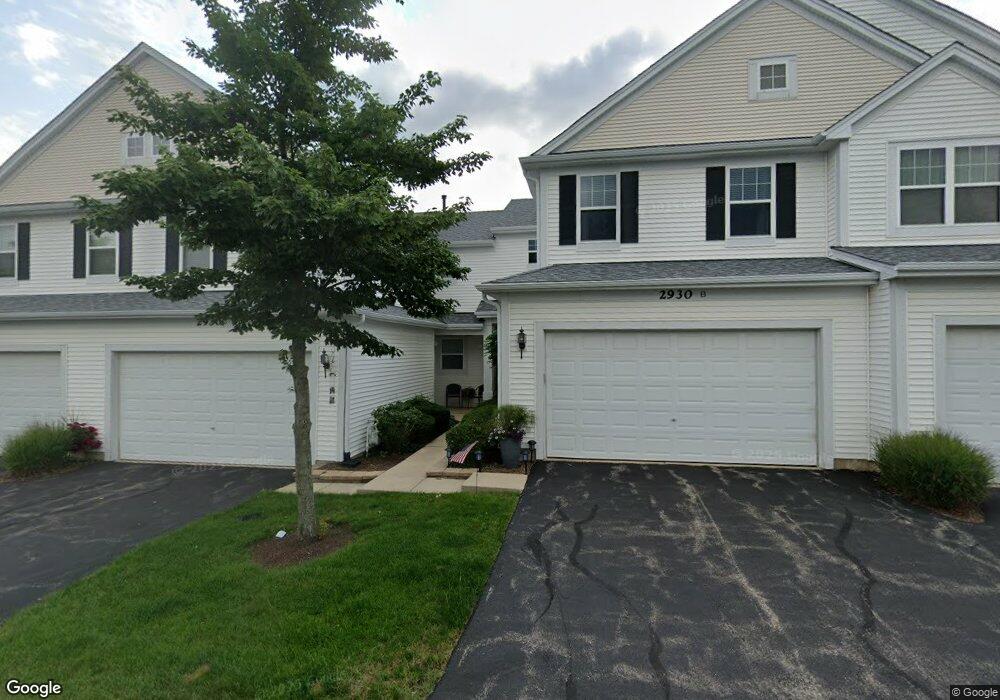
2930 Glacier Way Unit 2D Wauconda, IL 60084
Estimated Value: $318,000 - $342,000
3
Beds
3
Baths
1,750
Sq Ft
$189/Sq Ft
Est. Value
About This Home
This home is located at 2930 Glacier Way Unit 2D, Wauconda, IL 60084 and is currently estimated at $331,002, approximately $189 per square foot. 2930 Glacier Way Unit 2D is a home located in Lake County with nearby schools including Robert Crown School, Jefferson Elementary School, and Wauconda Middle School.
Ownership History
Date
Name
Owned For
Owner Type
Purchase Details
Closed on
Mar 11, 2025
Sold by
Wells Jeffrey and Wells Neringa
Bought by
Collins Sammie Lynn and Collins Tatiana
Current Estimated Value
Purchase Details
Closed on
Sep 12, 2017
Sold by
Cook James E and James E Cook Declaration Of Li
Bought by
Wells Jeffrey and Wells Kimberly
Home Financials for this Owner
Home Financials are based on the most recent Mortgage that was taken out on this home.
Original Mortgage
$156,800
Interest Rate
3.9%
Mortgage Type
New Conventional
Purchase Details
Closed on
May 29, 2016
Sold by
Cook James E
Bought by
Cook James E and James E Cook Declaration Of Li
Purchase Details
Closed on
Aug 25, 2004
Sold by
Pinnacle Corp
Bought by
Cook James E
Home Financials for this Owner
Home Financials are based on the most recent Mortgage that was taken out on this home.
Original Mortgage
$216,350
Interest Rate
6.5%
Mortgage Type
Purchase Money Mortgage
Create a Home Valuation Report for This Property
The Home Valuation Report is an in-depth analysis detailing your home's value as well as a comparison with similar homes in the area
Home Values in the Area
Average Home Value in this Area
Purchase History
| Date | Buyer | Sale Price | Title Company |
|---|---|---|---|
| Collins Sammie Lynn | $322,500 | Old Republic Title | |
| Wells Jeffrey | $196,000 | First American Title Insuran | |
| Cook James E | -- | Attorney | |
| Cook James E | $240,500 | Chicago Title Insurance Comp |
Source: Public Records
Mortgage History
| Date | Status | Borrower | Loan Amount |
|---|---|---|---|
| Previous Owner | Wells Jeffrey | $156,800 | |
| Previous Owner | Cook James E | $216,350 |
Source: Public Records
Tax History Compared to Growth
Tax History
| Year | Tax Paid | Tax Assessment Tax Assessment Total Assessment is a certain percentage of the fair market value that is determined by local assessors to be the total taxable value of land and additions on the property. | Land | Improvement |
|---|---|---|---|---|
| 2024 | $6,494 | $74,813 | $8,813 | $66,000 |
| 2023 | $6,494 | $68,385 | $8,056 | $60,329 |
| 2022 | $7,274 | $67,576 | $7,643 | $59,933 |
| 2021 | $6,951 | $63,853 | $7,222 | $56,631 |
| 2020 | $7,415 | $60,858 | $6,883 | $53,975 |
| 2019 | $6,658 | $57,516 | $6,505 | $51,011 |
| 2018 | $7,863 | $63,931 | $9,616 | $54,315 |
| 2017 | $7,843 | $62,962 | $9,505 | $53,457 |
| 2016 | $7,421 | $59,623 | $9,001 | $50,622 |
| 2015 | $6,545 | $54,735 | $8,263 | $46,472 |
| 2014 | $6,038 | $49,428 | $9,519 | $39,909 |
| 2012 | $5,343 | $47,292 | $9,108 | $38,184 |
Source: Public Records
Map
Nearby Homes
- 2930 Glacier Way Unit A
- 2830 Cattail Ct Unit C
- 2820 Glacier Way Unit B
- 2558 Savanna Dr
- 2722 Moraine Valley Rd Unit 2A
- 2589 Savanna Dr
- 2511 Bluewater Dr Unit 1A
- 2227 Trailside Ln Unit 1B
- 29650 N Garland Rd
- 24570 W Chardon Rd
- 25651 W Il Route 60
- 2483 Olivia Ct
- 2472 Olivia Ct
- 683 Niagara Dr
- 252 Purcell Rd
- 1085 Adagio Dr
- 29564 N Garland Rd
- 0 W Chardon Rd
- 308 Niagara Dr
- 26222 Illinois 120
- 2930 Glacier Way Unit F
- 2930 Glacier Way Unit E
- 2930 Glacier Way Unit C
- 2930 Glacier Way Unit B
- 2930 Glacier Way
- 2920 Glacier Way Unit F
- 2920 Glacier Way Unit E
- 2920 Glacier Way Unit D
- 2920 Glacier Way Unit C
- 2920 Glacier Way Unit B
- 2920 Glacier Way Unit A
- 2940 Glacier Way Unit D
- 2940 Glacier Way Unit C
- 2940 Glacier Way Unit B
- 2940 Glacier Way Unit A
- 2910 Glacier Way Unit D
- 2910 Glacier Way Unit C
- 2910 Glacier Way Unit B
- 2910 Glacier Way Unit A
- 2910 Glacier Way Unit 4C