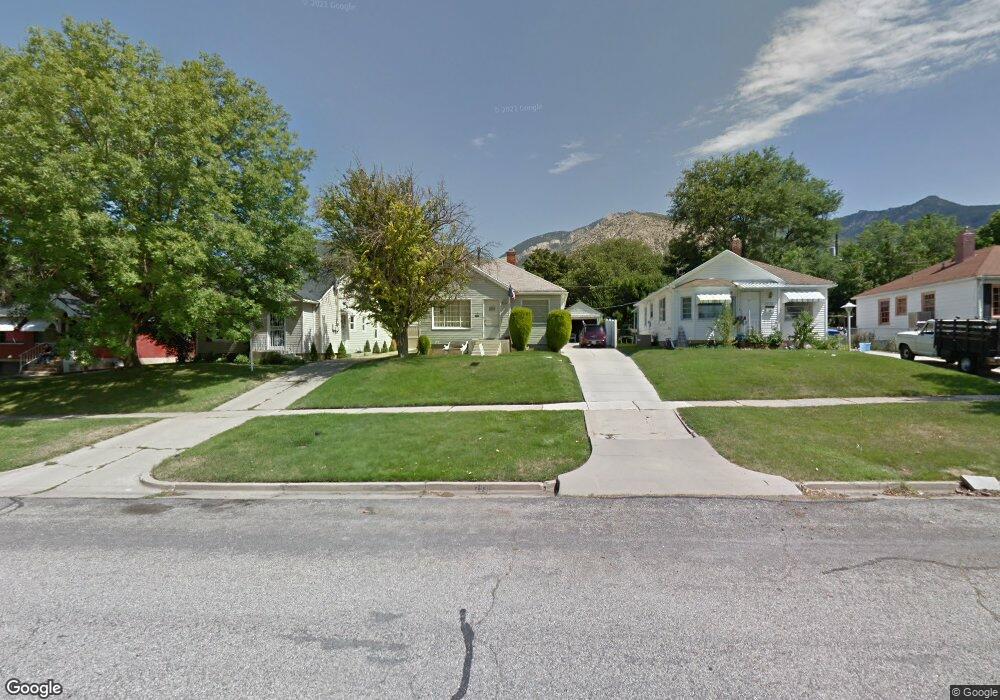
2930 Van Buren Ave Ogden, UT 84403
TO Smith NeighborhoodEstimated Value: $343,000 - $400,000
5
Beds
2
Baths
1,632
Sq Ft
$226/Sq Ft
Est. Value
About This Home
This home is located at 2930 Van Buren Ave, Ogden, UT 84403 and is currently estimated at $368,242, approximately $225 per square foot. 2930 Van Buren Ave is a home located in Weber County with nearby schools including Wasatch Elementary School, Mount Ogden Junior High School, and Ogden High School.
Ownership History
Date
Name
Owned For
Owner Type
Purchase Details
Closed on
Sep 30, 2020
Sold by
Ron The Nom Investing Llc
Bought by
Sanford Erin and Sanford Patrick
Current Estimated Value
Home Financials for this Owner
Home Financials are based on the most recent Mortgage that was taken out on this home.
Original Mortgage
$272,473
Outstanding Balance
$242,350
Interest Rate
2.9%
Mortgage Type
FHA
Estimated Equity
$125,892
Purchase Details
Closed on
Mar 24, 2020
Sold by
Ron The Nom Investing Llc
Bought by
Lloyd Brian G
Home Financials for this Owner
Home Financials are based on the most recent Mortgage that was taken out on this home.
Original Mortgage
$40,000
Interest Rate
3.4%
Mortgage Type
Unknown
Purchase Details
Closed on
Jan 10, 2020
Sold by
Orosco Lena L
Bought by
Ron The Nom Investing Llc
Purchase Details
Closed on
Nov 8, 2002
Sold by
Orosco Jeronimo L and Orosco Lena Lee
Bought by
Orosco Lena L
Home Financials for this Owner
Home Financials are based on the most recent Mortgage that was taken out on this home.
Original Mortgage
$56,000
Interest Rate
5.33%
Create a Home Valuation Report for This Property
The Home Valuation Report is an in-depth analysis detailing your home's value as well as a comparison with similar homes in the area
Home Values in the Area
Average Home Value in this Area
Purchase History
| Date | Buyer | Sale Price | Title Company |
|---|---|---|---|
| Sanford Erin | -- | Stewart Title Ins | |
| Lloyd Brian G | -- | None Available | |
| Ron The Nom Investing Llc | -- | Stewart Title Ins Agcy Of Ut | |
| Orosco Lena L | -- | Backman Stewart Title |
Source: Public Records
Mortgage History
| Date | Status | Borrower | Loan Amount |
|---|---|---|---|
| Open | Sanford Erin | $272,473 | |
| Previous Owner | Lloyd Brian G | $40,000 | |
| Previous Owner | Orosco Lena L | $56,000 |
Source: Public Records
Tax History
| Year | Tax Paid | Tax Assessment Tax Assessment Total Assessment is a certain percentage of the fair market value that is determined by local assessors to be the total taxable value of land and additions on the property. | Land | Improvement |
|---|---|---|---|---|
| 2025 | $2,338 | $342,755 | $103,074 | $239,681 |
| 2024 | $2,306 | $182,598 | $56,690 | $125,908 |
| 2023 | $2,174 | $173,250 | $54,180 | $119,070 |
| 2022 | $2,416 | $193,050 | $46,082 | $146,968 |
| 2021 | $1,750 | $231,999 | $53,910 | $178,089 |
| 2020 | $1,502 | $184,000 | $29,128 | $154,872 |
| 2019 | $1,504 | $173,001 | $29,128 | $143,873 |
| 2018 | $1,208 | $138,000 | $27,235 | $110,765 |
| 2017 | $1,031 | $110,000 | $27,235 | $82,765 |
| 2016 | $812 | $46,873 | $13,492 | $33,381 |
| 2015 | $832 | $46,872 | $13,492 | $33,380 |
| 2014 | $707 | $39,089 | $11,822 | $27,267 |
Source: Public Records
Map
Nearby Homes
- 2916 Brinker Ave
- 2843 Brinker Ave
- 2844 Eccles Ave
- 3026 Harrison Blvd
- 3040 Harrison Blvd
- 2784 Van Buren Ave
- 1289 30th St
- 1260 28th St
- 1119 Healy St
- 2764 Fowler Ave
- 1010 Sullivan Rd
- 1289 31st St
- 2721 Jackson Ave
- 3175 Iowa Ave
- 875 Patterson St
- 2839 S Van Buren Ave Unit 8
- 917 Sullivan Dr
- 1018 E 27th St S
- 3120 Tyler Ave
- 895 Sullivan Rd
- 2924 Van Buren Ave
- 2938 Van Buren Ave
- 2948 Van Buren Ave
- 2948 Van Buren Ave
- 2920 Van Buren Ave
- 2950 Van Buren Ave
- 2914 Van Buren Ave
- 2927 Brinker Ave
- 2945 Brinker Ave
- 2935 Van Buren Ave
- 2908 Van Buren Ave
- 2954 Van Buren Ave
- 2933 Brinker Ave
- 2919 Brinker Ave
- 2947 Brinker Ave
- 1125 29th St
- 2929 Van Buren Ave
- 2904 Van Buren Ave
- 2960 Van Buren Ave
- 2957 Brinker Ave