Estimated Value: $135,815 - $197,000
--
Bed
1
Bath
816
Sq Ft
$194/Sq Ft
Est. Value
About This Home
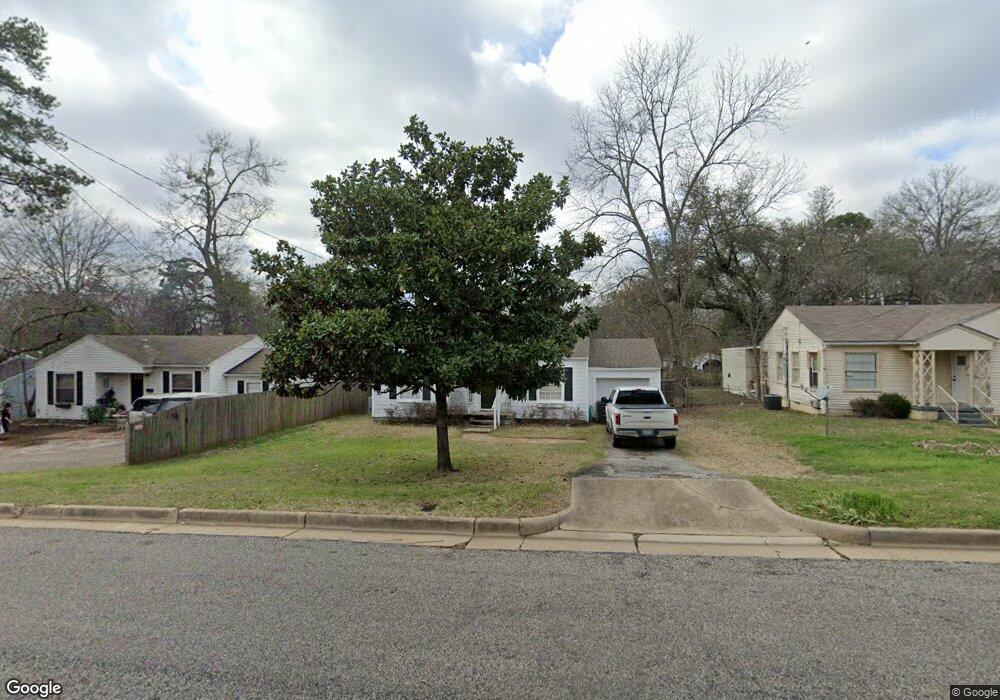
This home is located at 2931 New Copeland Rd, Tyler, TX 75701 and is currently estimated at $158,454, approximately $194 per square foot. 2931 New Copeland Rd is a home located in Smith County with nearby schools including Woods Elementary School, Hubbard Middle School, and Tyler Legacy High School.
Ownership History
Date
Name
Owned For
Owner Type
Purchase Details
Closed on
Feb 26, 2021
Sold by
Ballard Herbert Earl and Ballard Nancy Carroll
Bought by
Markle James Robert and Markle Leslie
Current Estimated Value
Purchase Details
Closed on
Jan 22, 2013
Sold by
Streich Annie Laurie and Strickland Annie Laurie
Bought by
Ballard Herbert E and Ballard Nancy C
Home Financials for this Owner
Home Financials are based on the most recent Mortgage that was taken out on this home.
Original Mortgage
$52,000
Interest Rate
3.33%
Mortgage Type
Purchase Money Mortgage
Purchase Details
Closed on
May 23, 2006
Sold by
Worsham David J and Worsham Patricia
Bought by
Strickland Annie Laurie
Home Financials for this Owner
Home Financials are based on the most recent Mortgage that was taken out on this home.
Original Mortgage
$65,000
Interest Rate
6.5%
Mortgage Type
New Conventional
Create a Home Valuation Report for This Property
The Home Valuation Report is an in-depth analysis detailing your home's value as well as a comparison with similar homes in the area
Home Values in the Area
Average Home Value in this Area
Purchase History
| Date | Buyer | Sale Price | Title Company |
|---|---|---|---|
| Markle James Robert | -- | Atc | |
| Ballard Herbert E | -- | None Available | |
| Strickland Annie Laurie | -- | None Available |
Source: Public Records
Mortgage History
| Date | Status | Borrower | Loan Amount |
|---|---|---|---|
| Previous Owner | Ballard Herbert E | $52,000 | |
| Previous Owner | Strickland Annie Laurie | $65,000 |
Source: Public Records
Tax History Compared to Growth
Tax History
| Year | Tax Paid | Tax Assessment Tax Assessment Total Assessment is a certain percentage of the fair market value that is determined by local assessors to be the total taxable value of land and additions on the property. | Land | Improvement |
|---|---|---|---|---|
| 2025 | $1,880 | $102,564 | $32,106 | $70,458 |
| 2024 | $1,880 | $110,504 | $20,985 | $89,519 |
| 2023 | $1,697 | $97,360 | $20,985 | $76,375 |
| 2022 | $1,682 | $85,862 | $19,166 | $66,696 |
| 2021 | $1,266 | $60,350 | $19,166 | $41,184 |
| 2020 | $1,279 | $59,770 | $19,166 | $40,604 |
| 2019 | $1,330 | $60,839 | $19,166 | $41,673 |
| 2018 | $1,188 | $54,611 | $13,990 | $40,621 |
| 2017 | $1,166 | $54,611 | $13,990 | $40,621 |
| 2016 | $1,144 | $53,588 | $13,990 | $39,598 |
| 2015 | $1,079 | $52,304 | $13,990 | $38,314 |
| 2014 | $1,079 | $50,771 | $13,990 | $36,781 |
Source: Public Records
Map
Nearby Homes
- 611 E Watkins St
- 315 Ridgecrest Dr
- 3202 S Donnybrook Ave
- 3210 S Donnybrook Ave
- 317 Amberwood Cir
- 905 E Watkins St
- 904 E Dulse St
- 2835 S Broadway Ave
- 121 Fair Ln
- 1024 Clyde Dr
- 1018 Pollard Dr
- 1101 Clyde Dr
- 2736 Old Bullard Rd
- 1102 S Peach Ave S
- 515 & 517 Charnwood St
- 3922 & 3928 McDonald Rd
- 3006 de Charles St
- 3511 S Keaton Ave
- 309 Glenhaven Dr
- 3200 Decharles St
- 2937 New Copeland Rd
- 2927 New Copeland Rd
- 2927 2927 Copeland Rd
- 3003 New Copeland Rd
- 2923 New Copeland Rd
- 3003 3003 Copeland Rd
- 2930 Crestview St
- 2926 Crestview St
- 2915 New Copeland Rd
- 3009 New Copeland Rd
- 0 S Vine Unit 29342199
- 3004 Crestview St
- 2916 Crestview St
- 2926 2926 Crestview
- 2924 New Copeland Rd
- 3004 3004 Crestview Ave
- 600 Clyde Dr
- 2916 2916 Crestview
- 2930 New Copeland Rd
- 2914 Crestview St