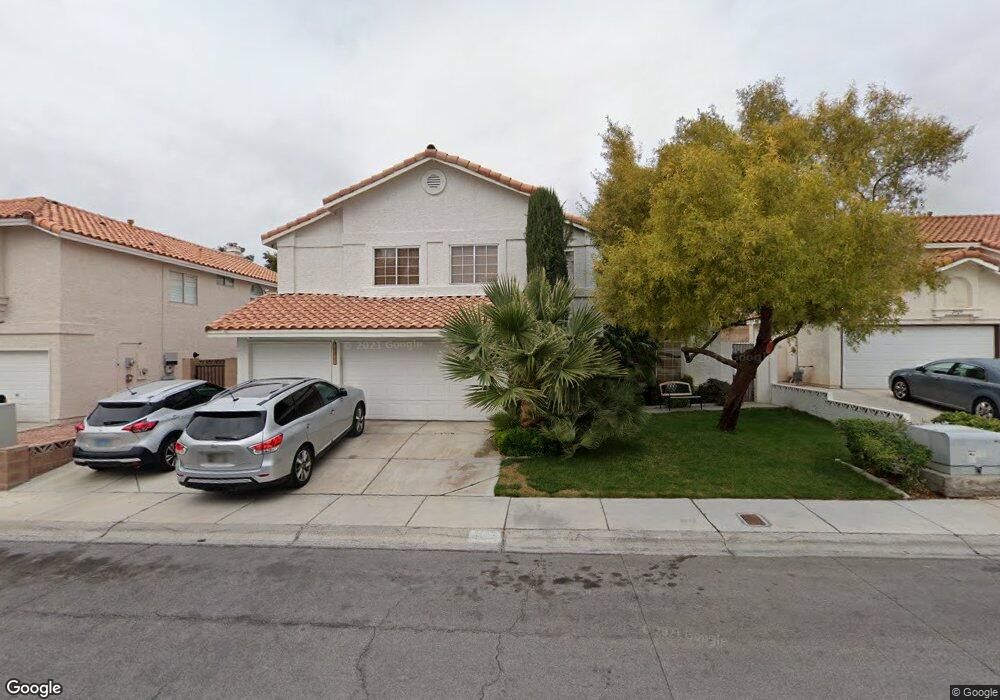
2933 Caressa Ct Unit 10B Las Vegas, NV 89117
The Section Seven NeighborhoodEstimated Value: $641,000 - $710,000
4
Beds
3
Baths
2,785
Sq Ft
$240/Sq Ft
Est. Value
About This Home
This home is located at 2933 Caressa Ct Unit 10B, Las Vegas, NV 89117 and is currently estimated at $669,093, approximately $240 per square foot. 2933 Caressa Ct Unit 10B is a home located in Clark County with nearby schools including M J Christensen Elementary School, Clifford J Lawrence Junior High School, and Bonanza High School.
Ownership History
Date
Name
Owned For
Owner Type
Purchase Details
Closed on
Mar 4, 2002
Sold by
Mays George L and Mays Carol A
Bought by
Mangrum Charlie and Taylor Terri L
Current Estimated Value
Home Financials for this Owner
Home Financials are based on the most recent Mortgage that was taken out on this home.
Original Mortgage
$220,500
Outstanding Balance
$116,590
Interest Rate
10.99%
Estimated Equity
$552,503
Create a Home Valuation Report for This Property
The Home Valuation Report is an in-depth analysis detailing your home's value as well as a comparison with similar homes in the area
Home Values in the Area
Average Home Value in this Area
Purchase History
| Date | Buyer | Sale Price | Title Company |
|---|---|---|---|
| Mangrum Charlie | $245,000 | Nevada Title Company |
Source: Public Records
Mortgage History
| Date | Status | Borrower | Loan Amount |
|---|---|---|---|
| Open | Mangrum Charlie | $220,500 |
Source: Public Records
Tax History Compared to Growth
Tax History
| Year | Tax Paid | Tax Assessment Tax Assessment Total Assessment is a certain percentage of the fair market value that is determined by local assessors to be the total taxable value of land and additions on the property. | Land | Improvement |
|---|---|---|---|---|
| 2025 | $3,768 | $134,829 | $57,050 | $77,779 |
| 2024 | $3,490 | $134,829 | $57,050 | $77,779 |
| 2023 | $3,490 | $121,913 | $47,250 | $74,663 |
| 2022 | $3,232 | $105,842 | $36,750 | $69,092 |
| 2021 | $2,993 | $102,377 | $36,400 | $65,977 |
| 2020 | $2,776 | $98,839 | $32,900 | $65,939 |
| 2019 | $2,601 | $92,490 | $26,950 | $65,540 |
| 2018 | $2,482 | $89,863 | $26,600 | $63,263 |
| 2017 | $2,934 | $89,501 | $24,850 | $64,651 |
| 2016 | $2,324 | $82,615 | $17,500 | $65,115 |
| 2015 | $2,319 | $72,015 | $16,450 | $55,565 |
| 2014 | $2,251 | $66,618 | $8,750 | $57,868 |
Source: Public Records
Map
Nearby Homes
- 9429 Abalone Way
- 2913 Domino Way
- 3009 Periscope Ct
- 9113 Anchor Cove Ct
- 9100 Shelter Cove Ct
- 3040 Ocean Port Dr
- 9504 Cliff View Way
- 9312 Angelfish Dr
- 2712 Quail Roost Way
- 9548 Wooden Pier Way
- 9544 Lazy River Dr
- 9605 Blowing Sand Cir
- 9021 Feather River Ct
- 9713 Cascade Falls Ave
- 9624 Beach Water Cir
- 9708 Blazing Star Ct
- 9724 Cascade Falls Ave
- 2728 Monrovia Dr
- 2724 Monrovia Dr
- 3205 Bermuda Bay St
- 2929 Caressa Ct
- 2937 Caressa Ct
- 2932 Charring Cross Way
- 2928 Charring Cross Way
- 2936 Charring Cross Way
- 2932 Caressa Ct
- 2925 Caressa Ct
- 2925 Caressa Ct Unit None
- 2924 Charring Cross Way
- 2928 Caressa Ct
- 9405 Darwell Dr
- 2920 Caressa Ct
- 9401 Darwell Dr
- 2924 Caressa Ct
- 9409 Darwell Dr
- 2920 Charring Cross Way
- 9325 Darwell Dr
- 9425 Whittier Ct
- 9413 Darwell Dr
- 9424 Darwell Dr