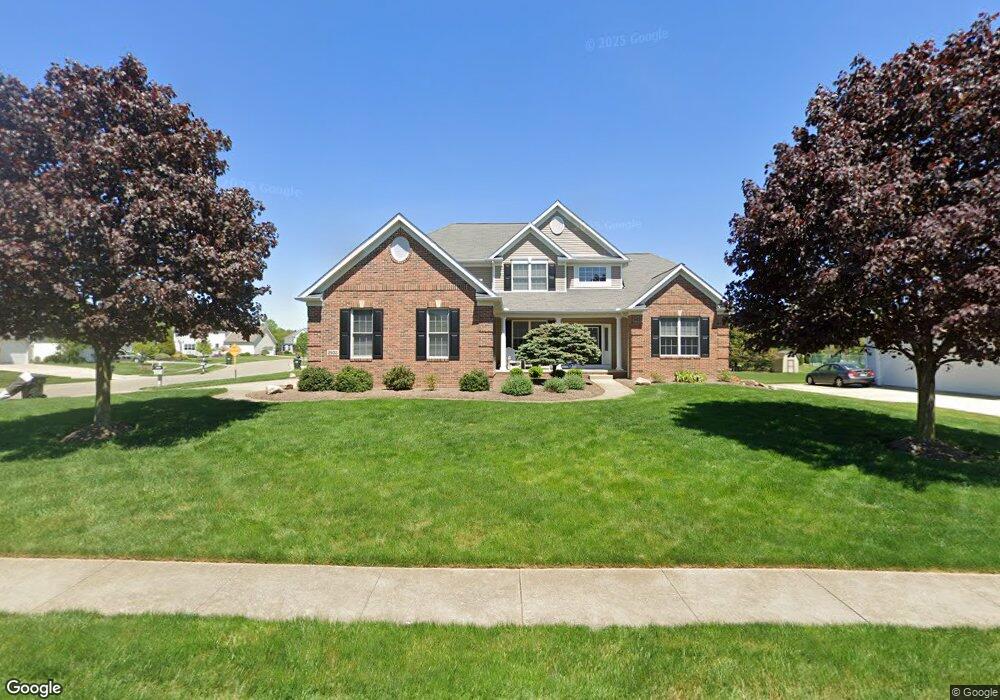
2933 Carriage Stone St NW Uniontown, OH 44685
Estimated Value: $472,452 - $529,000
4
Beds
3
Baths
2,896
Sq Ft
$172/Sq Ft
Est. Value
About This Home
This home is located at 2933 Carriage Stone St NW, Uniontown, OH 44685 and is currently estimated at $497,613, approximately $171 per square foot. 2933 Carriage Stone St NW is a home located in Stark County with nearby schools including Lake Middle/High School and Lake Center Christian School.
Ownership History
Date
Name
Owned For
Owner Type
Purchase Details
Closed on
Mar 30, 2010
Sold by
Kennedy Opha O and Kennedy Mary K
Bought by
Sedmock Patrick P and Sedmock Christine M
Current Estimated Value
Home Financials for this Owner
Home Financials are based on the most recent Mortgage that was taken out on this home.
Original Mortgage
$236,800
Outstanding Balance
$157,404
Interest Rate
4.96%
Mortgage Type
New Conventional
Estimated Equity
$340,209
Purchase Details
Closed on
Jun 20, 2005
Sold by
Scott Mccue Homes Inc
Bought by
Kennedy Opha O and Kennedy Mary K
Home Financials for this Owner
Home Financials are based on the most recent Mortgage that was taken out on this home.
Original Mortgage
$248,800
Interest Rate
5.25%
Mortgage Type
Fannie Mae Freddie Mac
Purchase Details
Closed on
Oct 21, 2004
Sold by
Mgk Ltd
Bought by
Scott Mccue Homes Inc
Home Financials for this Owner
Home Financials are based on the most recent Mortgage that was taken out on this home.
Original Mortgage
$215,000
Interest Rate
5.8%
Mortgage Type
Construction
Create a Home Valuation Report for This Property
The Home Valuation Report is an in-depth analysis detailing your home's value as well as a comparison with similar homes in the area
Home Values in the Area
Average Home Value in this Area
Purchase History
| Date | Buyer | Sale Price | Title Company |
|---|---|---|---|
| Sedmock Patrick P | $296,000 | Attorney | |
| Kennedy Opha O | $311,000 | -- | |
| Scott Mccue Homes Inc | $51,900 | -- |
Source: Public Records
Mortgage History
| Date | Status | Borrower | Loan Amount |
|---|---|---|---|
| Open | Sedmock Patrick P | $236,800 | |
| Previous Owner | Kennedy Opha O | $248,800 | |
| Previous Owner | Scott Mccue Homes Inc | $215,000 |
Source: Public Records
Tax History Compared to Growth
Tax History
| Year | Tax Paid | Tax Assessment Tax Assessment Total Assessment is a certain percentage of the fair market value that is determined by local assessors to be the total taxable value of land and additions on the property. | Land | Improvement |
|---|---|---|---|---|
| 2025 | -- | $144,560 | $35,670 | $108,890 |
| 2024 | -- | $144,560 | $35,670 | $108,890 |
| 2023 | $6,403 | $122,470 | $29,190 | $93,280 |
| 2022 | $6,425 | $122,470 | $29,190 | $93,280 |
| 2021 | $6,493 | $122,470 | $29,190 | $93,280 |
| 2020 | $6,210 | $104,520 | $25,170 | $79,350 |
| 2019 | $6,164 | $104,520 | $25,170 | $79,350 |
| 2018 | $6,176 | $104,520 | $25,170 | $79,350 |
| 2017 | $6,502 | $101,790 | $22,580 | $79,210 |
| 2016 | $6,514 | $101,790 | $22,580 | $79,210 |
| 2015 | $6,513 | $101,790 | $22,580 | $79,210 |
| 2014 | $1,397 | $86,350 | $19,150 | $67,200 |
| 2013 | $2,699 | $86,350 | $19,150 | $67,200 |
Source: Public Records
Map
Nearby Homes
- 12235 Cantburg Ave NW
- 843 Brodie Ct
- 835 Brodie Ct
- 12494 Bridgemont Ave NW
- 2693 Ledgestone Dr NW
- 2335 Ledgestone Dr NW
- 2273 Ledgestone Dr NW
- 2319 Ledgestone Dr NW
- 2255 Ledgestone Dr NW
- 2334 Ledgestone Dr NW
- 2244 Ledgestone Dr NW
- 2316 Ledgestone Dr NW
- 2490 Ledgestone Dr NW
- 2601 Lake Center St NW
- 12855 Redwood Ave NW
- 0 Pine St NW
- 3648 Mulberry St NW
- 13025 Sunset Cir NW
- 3771 Edison St NW
- 12374 Springwater Ave NW
- 2911 Carriage Stone St NW
- 12290 Cantburg Ave NW
- 12273 Cantburg Ave NW
- 12273-(SL 51) Cantburg
- 12317 (S/L 53) Cantburg Ave NW
- 2893 Carriage Stone St NW
- 12316 Cantburg Ave NW
- 2934 Carriage Stone St NW
- 12291 S/L 52 Cantburg Ave NW
- 2912 Carriage Stone St NW
- 12316 (S/L 75) Cantburg Ave NW
- 12291 Cantburg Ave NW
- 12317 Cantburg Ave NW
- 2922 (S/L 74) Londonbury St NW
- 2922 Londonbury St NW
- 2894 Carriage Stone St NW
- 12217 Cantburg Ave NW
- 2968 Londonbury St NW
- 2892 Londonbury St NW
- 2906 Londonbury St NW