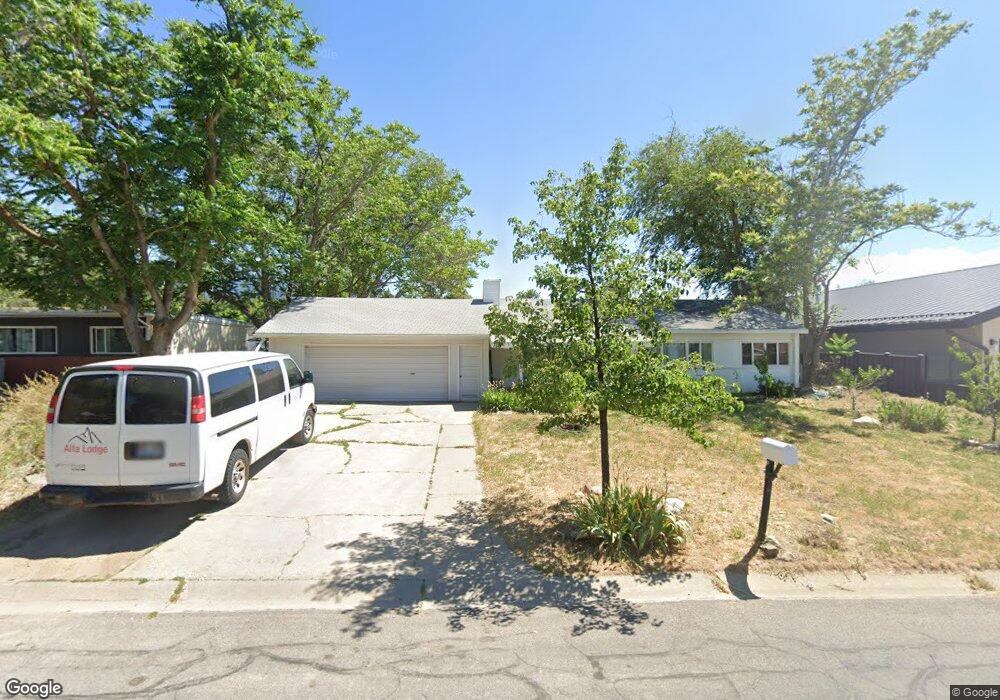
2934 E 7375 S Salt Lake City, UT 84121
Estimated Value: $463,000 - $1,111,000
3
Beds
1
Bath
1,057
Sq Ft
$624/Sq Ft
Est. Value
About This Home
This home is located at 2934 E 7375 S, Salt Lake City, UT 84121 and is currently estimated at $659,268, approximately $623 per square foot. 2934 E 7375 S is a home located in Salt Lake County with nearby schools including Butler School, Butler Middle School, and Brighton High School.
Ownership History
Date
Name
Owned For
Owner Type
Purchase Details
Closed on
Aug 23, 2012
Sold by
Daubney Jeff and Noack Iris
Bought by
Hart Creghton
Current Estimated Value
Purchase Details
Closed on
Nov 9, 2007
Sold by
Smart Dwayne K
Bought by
Daubney Jeff and Noack Iris
Home Financials for this Owner
Home Financials are based on the most recent Mortgage that was taken out on this home.
Original Mortgage
$208,050
Interest Rate
6.4%
Mortgage Type
Unknown
Purchase Details
Closed on
May 3, 2004
Sold by
Eggertz David Paul
Bought by
Smart Dwayne K
Purchase Details
Closed on
Jan 21, 2004
Sold by
Eggertz David Paul and Kennedy Traci
Bought by
Eggertz David Paul
Purchase Details
Closed on
May 24, 1996
Sold by
Mclennan Charles Douglas
Bought by
Jimenez Trai and Eggertz David Paul
Home Financials for this Owner
Home Financials are based on the most recent Mortgage that was taken out on this home.
Original Mortgage
$111,350
Interest Rate
7.97%
Mortgage Type
FHA
Create a Home Valuation Report for This Property
The Home Valuation Report is an in-depth analysis detailing your home's value as well as a comparison with similar homes in the area
Home Values in the Area
Average Home Value in this Area
Purchase History
| Date | Buyer | Sale Price | Title Company |
|---|---|---|---|
| Hart Creghton | -- | First American Title | |
| Daubney Jeff | -- | Equity Title | |
| Smart Dwayne K | -- | First American Title | |
| Eggertz David Paul | -- | -- | |
| Jimenez Trai | -- | -- |
Source: Public Records
Mortgage History
| Date | Status | Borrower | Loan Amount |
|---|---|---|---|
| Previous Owner | Daubney Jeff | $208,050 | |
| Previous Owner | Jimenez Trai | $111,350 |
Source: Public Records
Tax History Compared to Growth
Tax History
| Year | Tax Paid | Tax Assessment Tax Assessment Total Assessment is a certain percentage of the fair market value that is determined by local assessors to be the total taxable value of land and additions on the property. | Land | Improvement |
|---|---|---|---|---|
| 2025 | $2,047 | $389,200 | $151,600 | $237,600 |
| 2024 | $2,047 | $317,200 | $136,500 | $180,700 |
| 2023 | $1,931 | $310,300 | $129,700 | $180,600 |
| 2022 | $2,020 | $324,200 | $127,200 | $197,000 |
| 2021 | $1,840 | $234,800 | $101,100 | $133,700 |
| 2020 | $1,826 | $213,400 | $101,100 | $112,300 |
| 2019 | $1,850 | $213,200 | $95,400 | $117,800 |
| 2018 | $1,649 | $203,900 | $95,400 | $108,500 |
| 2017 | $1,524 | $190,900 | $95,400 | $95,500 |
| 2016 | $1,499 | $188,700 | $95,400 | $93,300 |
| 2015 | $1,121 | $160,100 | $92,500 | $67,600 |
| 2014 | $971 | $161,000 | $94,400 | $66,600 |
Source: Public Records
Map
Nearby Homes
- 2944 E 7230 S
- 3071 E 7335 S
- 7506 Claret St
- 7491 S 2700 E
- 2673 Toni Cir
- 2995 E 7110 S
- 2712 E 7115 S
- 7129 S 3080 E
- 2862 E Pamela Dr
- 7622 S Cambria Cir
- 3184 Barnhill Bay
- 2968 Pine View Dr S
- 3404 Enchanted Hills Dr
- 6877 Pineview Cir
- 2935 E Denmark Dr
- 7450 S 2340 E
- 2366 Cinnabar Ln
- 7911 Willowcrest Rd
- 6910 S Promenade Dr
- 2288 E Emerald Hills Ct Unit 2
- 2946 E 7375 S
- 2922 E 7375 S
- 2931 Banbury Rd
- 2931 E Banbury Rd
- 2919 Banbury Rd
- 2941 Banbury Rd
- 2941 E Banbury Rd
- 2960 E 7375 S
- 2910 E 7375 S
- 7405 Westerling Way
- 2953 E Banbury Rd
- 2931 E 7375 S
- 2945 E 7375 S
- 7405 S Westerling Way
- 2919 E 7375 S
- 2970 E 7375 S
- 2955 E 7375 S
- 2963 Banbury Rd
- 2893 Banbury Rd
- 2905 E 7375 S