Estimated Value: $179,185 - $201,000
--
Bed
1
Bath
1,051
Sq Ft
$182/Sq Ft
Est. Value
About This Home
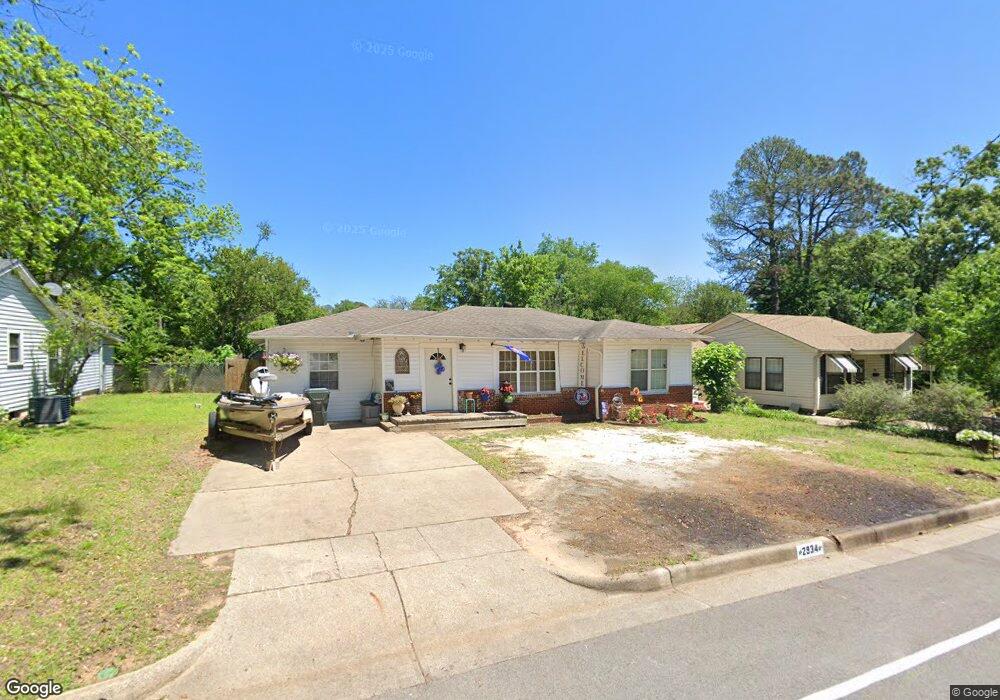
This home is located at 2934 S Donnybrook Ave, Tyler, TX 75701 and is currently estimated at $191,046, approximately $181 per square foot. 2934 S Donnybrook Ave is a home located in Smith County with nearby schools including Woods Elementary School, Hubbard Middle School, and Tyler Legacy High School.
Ownership History
Date
Name
Owned For
Owner Type
Purchase Details
Closed on
Jun 20, 2011
Sold by
Paul Taylor
Bought by
Paul Shay
Current Estimated Value
Purchase Details
Closed on
May 18, 2011
Sold by
Deutsche Bank National Trust Company
Bought by
Paul Taylor
Purchase Details
Closed on
Dec 9, 2010
Sold by
Sisemore Cheryl and New Century Mortgage Corporati
Bought by
Deutsche Bank National Trust Company
Purchase Details
Closed on
Aug 30, 2005
Sold by
Bonner Timothy W and Bonner Tami L
Bought by
Sisemore Cheryl
Home Financials for this Owner
Home Financials are based on the most recent Mortgage that was taken out on this home.
Original Mortgage
$63,000
Interest Rate
6.25%
Mortgage Type
Adjustable Rate Mortgage/ARM
Create a Home Valuation Report for This Property
The Home Valuation Report is an in-depth analysis detailing your home's value as well as a comparison with similar homes in the area
Home Values in the Area
Average Home Value in this Area
Purchase History
| Date | Buyer | Sale Price | Title Company |
|---|---|---|---|
| Paul Shay | -- | None Available | |
| Paul Taylor | -- | Lsi Title Agency Inc | |
| Deutsche Bank National Trust Company | $65,070 | None Available | |
| Deutsche Bank National Trust Company | $65,070 | None Available | |
| Sisemore Cheryl | -- | None Available | |
| Sisemore Cheryl | -- | None Available |
Source: Public Records
Mortgage History
| Date | Status | Borrower | Loan Amount |
|---|---|---|---|
| Previous Owner | Sisemore Cheryl | $63,000 |
Source: Public Records
Tax History Compared to Growth
Tax History
| Year | Tax Paid | Tax Assessment Tax Assessment Total Assessment is a certain percentage of the fair market value that is determined by local assessors to be the total taxable value of land and additions on the property. | Land | Improvement |
|---|---|---|---|---|
| 2025 | $924 | $165,887 | $31,002 | $134,885 |
| 2024 | $924 | $109,885 | $12,375 | $136,800 |
| 2023 | $1,741 | $128,314 | $12,375 | $115,939 |
| 2022 | $1,779 | $105,141 | $11,303 | $93,838 |
| 2021 | $1,732 | $82,558 | $11,303 | $71,255 |
| 2020 | $1,745 | $81,555 | $11,303 | $70,252 |
| 2019 | $1,751 | $80,085 | $11,303 | $68,782 |
| 2018 | $1,583 | $72,779 | $8,250 | $64,529 |
| 2017 | $1,610 | $75,396 | $8,250 | $67,146 |
| 2016 | $1,540 | $72,141 | $8,250 | $63,891 |
| 2015 | $1,184 | $68,383 | $8,250 | $60,133 |
| 2014 | $1,184 | $66,117 | $8,250 | $57,867 |
Source: Public Records
Map
Nearby Homes
- 315 Ridgecrest Dr
- 3202 S Donnybrook Ave
- 3210 S Donnybrook Ave
- 611 E Watkins St
- 317 Amberwood Cir
- 121 Fair Ln
- 2835 S Broadway Ave
- 2736 Old Bullard Rd
- 905 E Watkins St
- 3300 Old Bullard Rd
- 309 Glenhaven Dr
- 403 Beechwood Dr
- 904 E Dulse St
- 3308 Greenoak Place
- 1018 Pollard Dr
- 1024 Clyde Dr
- 3511 S Keaton Ave
- 1101 Clyde Dr
- 2917 Sunnybrook Dr
- 1102 S Peach Ave S
- 2938 2938 Donnybrook Ave
- 2938 S Donnybrook Ave
- 2930 2930 Donnybrook
- 2930 S Donnybrook Ave
- 2713 S Donnybrook Ave
- 2721 S Donnybrook Ave
- 2707 S Donnybrook Ave
- 2717 S Donnybrook Ave
- 3003 Crestview St
- 3001 Crestview St
- 3007 Crestview St
- 315 315 Ridgecrest
- 404 Stanford St
- 2920 S Donnybrook Ave
- 2929 Crestview St
- 316 Ridgecrest Dr
- 410 Stanford St
- 316 316 Ridgecrest Dr
- 3011 Crestview St
- 2925 Crestview St