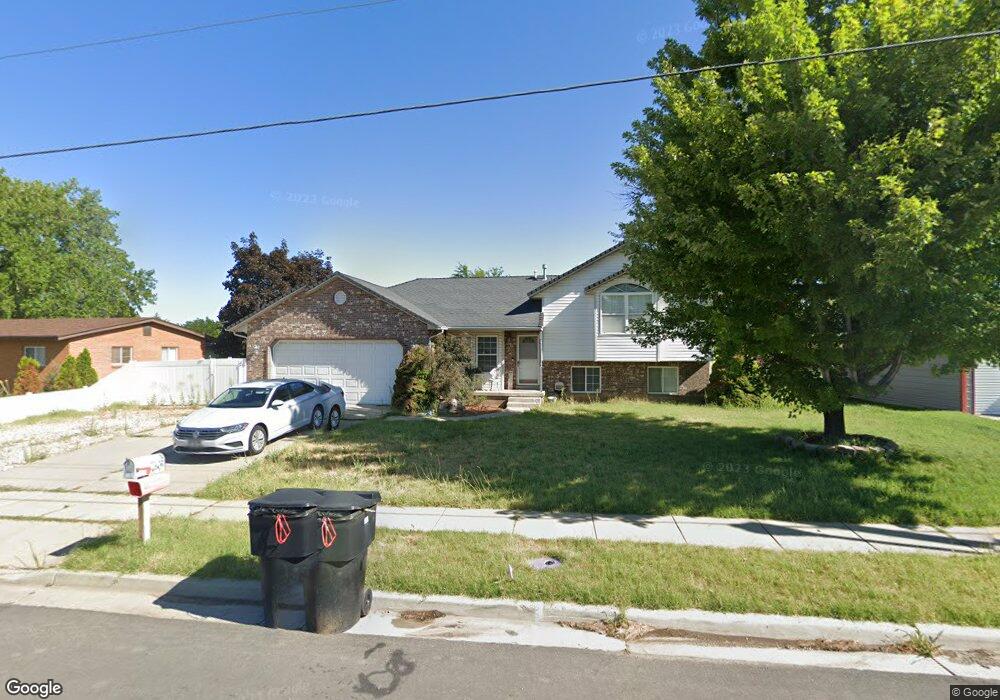
2934 W 800 N Clearfield, UT 84015
Estimated Value: $476,000 - $563,000
4
Beds
3
Baths
1,921
Sq Ft
$265/Sq Ft
Est. Value
About This Home
This home is located at 2934 W 800 N, Clearfield, UT 84015 and is currently estimated at $509,474, approximately $265 per square foot. 2934 W 800 N is a home located in Davis County with nearby schools including Lakeside School, West Point Junior High School, and Syracuse High School.
Ownership History
Date
Name
Owned For
Owner Type
Purchase Details
Closed on
Feb 5, 2021
Sold by
Sorensen Shea C and Sorensen Stefani
Bought by
Venable Jesse Adam
Current Estimated Value
Home Financials for this Owner
Home Financials are based on the most recent Mortgage that was taken out on this home.
Original Mortgage
$409,200
Outstanding Balance
$364,826
Interest Rate
2.65%
Mortgage Type
VA
Estimated Equity
$144,648
Purchase Details
Closed on
Feb 28, 2003
Sold by
Sulser Shawn P and Sulser Monica
Bought by
Thomas Michael John and Thomas Jennifer Jean
Home Financials for this Owner
Home Financials are based on the most recent Mortgage that was taken out on this home.
Original Mortgage
$144,060
Interest Rate
5.93%
Create a Home Valuation Report for This Property
The Home Valuation Report is an in-depth analysis detailing your home's value as well as a comparison with similar homes in the area
Home Values in the Area
Average Home Value in this Area
Purchase History
| Date | Buyer | Sale Price | Title Company |
|---|---|---|---|
| Venable Jesse Adam | -- | Mountain View Title | |
| Thomas Michael John | -- | Heritage West Title Insuranc |
Source: Public Records
Mortgage History
| Date | Status | Borrower | Loan Amount |
|---|---|---|---|
| Open | Venable Jesse Adam | $409,200 | |
| Previous Owner | Thomas Michael John | $144,060 |
Source: Public Records
Tax History Compared to Growth
Tax History
| Year | Tax Paid | Tax Assessment Tax Assessment Total Assessment is a certain percentage of the fair market value that is determined by local assessors to be the total taxable value of land and additions on the property. | Land | Improvement |
|---|---|---|---|---|
| 2025 | $2,597 | $249,700 | $99,946 | $149,754 |
| 2024 | $2,566 | $248,049 | $108,828 | $139,221 |
| 2023 | $2,332 | $229,350 | $69,098 | $160,251 |
| 2022 | $2,596 | $467,000 | $135,723 | $331,277 |
| 2021 | $2,378 | $349,000 | $97,194 | $251,806 |
| 2020 | $1,811 | $263,000 | $84,634 | $178,366 |
| 2019 | $1,762 | $250,000 | $95,134 | $154,866 |
| 2018 | $1,628 | $227,000 | $79,874 | $147,126 |
| 2016 | $1,473 | $106,040 | $31,521 | $74,519 |
| 2015 | $1,333 | $91,245 | $31,521 | $59,724 |
| 2014 | $1,138 | $79,134 | $31,521 | $47,613 |
| 2013 | -- | $83,422 | $24,844 | $58,578 |
Source: Public Records
Map
Nearby Homes