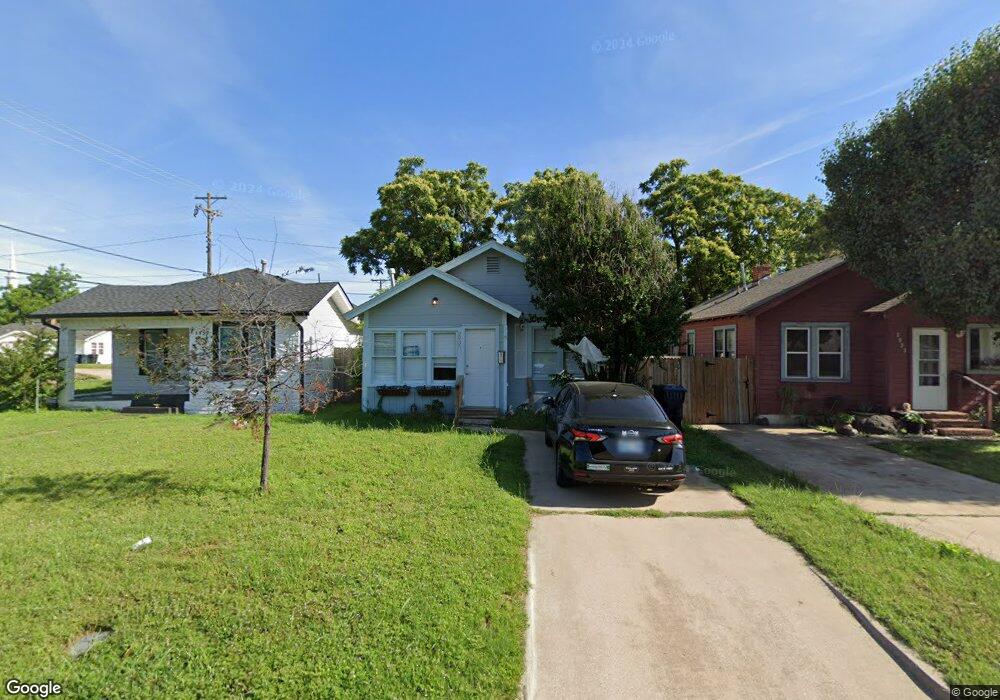
2935 North Place Oklahoma City, OK 73107
Milam Place NeighborhoodEstimated Value: $90,000 - $119,000
2
Beds
1
Bath
722
Sq Ft
$140/Sq Ft
Est. Value
About This Home
This home is located at 2935 North Place, Oklahoma City, OK 73107 and is currently estimated at $100,742, approximately $139 per square foot. 2935 North Place is a home located in Oklahoma County with nearby schools including Kaiser Elementary School, Taft Middle School, and Northwest Classen High School.
Ownership History
Date
Name
Owned For
Owner Type
Purchase Details
Closed on
Jun 3, 2009
Sold by
Rains Traylor E
Bought by
Jones Carrie R
Current Estimated Value
Home Financials for this Owner
Home Financials are based on the most recent Mortgage that was taken out on this home.
Original Mortgage
$53,512
Outstanding Balance
$33,937
Interest Rate
4.84%
Mortgage Type
FHA
Estimated Equity
$66,805
Purchase Details
Closed on
Jun 22, 2007
Sold by
Richardson David E and Richardson Carole
Bought by
Rains Traylor E
Home Financials for this Owner
Home Financials are based on the most recent Mortgage that was taken out on this home.
Original Mortgage
$48,500
Interest Rate
6.37%
Mortgage Type
Purchase Money Mortgage
Purchase Details
Closed on
Sep 12, 2006
Sold by
Nguyen Hung Kim and Bui Dao Anh Thi
Bought by
Richardson David E
Home Financials for this Owner
Home Financials are based on the most recent Mortgage that was taken out on this home.
Original Mortgage
$16,900
Interest Rate
6.51%
Mortgage Type
Purchase Money Mortgage
Create a Home Valuation Report for This Property
The Home Valuation Report is an in-depth analysis detailing your home's value as well as a comparison with similar homes in the area
Home Values in the Area
Average Home Value in this Area
Purchase History
| Date | Buyer | Sale Price | Title Company |
|---|---|---|---|
| Jones Carrie R | $54,500 | Stewart Abstract & Title Of | |
| Rains Traylor E | $48,500 | The Oklahoma City Abstract & | |
| Richardson David E | $17,000 | Oklahoma City Abstract & Tit |
Source: Public Records
Mortgage History
| Date | Status | Borrower | Loan Amount |
|---|---|---|---|
| Open | Jones Carrie R | $53,512 | |
| Previous Owner | Rains Traylor E | $48,500 | |
| Previous Owner | Richardson David E | $16,900 |
Source: Public Records
Tax History Compared to Growth
Tax History
| Year | Tax Paid | Tax Assessment Tax Assessment Total Assessment is a certain percentage of the fair market value that is determined by local assessors to be the total taxable value of land and additions on the property. | Land | Improvement |
|---|---|---|---|---|
| 2024 | $783 | $6,699 | $832 | $5,867 |
| 2023 | $783 | $6,379 | $925 | $5,454 |
| 2022 | $715 | $6,075 | $931 | $5,144 |
| 2021 | $681 | $5,786 | $1,068 | $4,718 |
| 2020 | $656 | $5,511 | $731 | $4,780 |
| 2019 | $625 | $5,249 | $753 | $4,496 |
| 2018 | $567 | $5,000 | $0 | $0 |
| 2017 | $540 | $4,761 | $727 | $4,034 |
| 2016 | $514 | $4,534 | $714 | $3,820 |
| 2015 | $380 | $4,318 | $746 | $3,572 |
| 2014 | $363 | $4,193 | $754 | $3,439 |
Source: Public Records
Map
Nearby Homes
- 2208 N Brookline Ave
- 3104 NW 21st St
- 3105 NW 22nd St
- 2841 NW 20th St
- 2822 NW 19th St
- 2854 NW 19th St
- 3117 NW 23rd St
- 3013 NW 24th St
- 2809 NW 21st St
- 3217 NW 22nd St
- 3216 NW 19th St
- 3232 NW 21st St
- 2765 NW 20th St
- 3157 NW 25th St
- 2939 NW 15th St
- 2748 NW 22nd St
- 2749 NW 22nd St
- 3132 NW 16th St
- 2934 NW 15th St
- 1521 N Drexel Blvd
- 2937 North Place
- 2933 North Place
- 2929 North Place
- 2936 NW 21st St
- 2930 NW 21st St
- 3022 North Place
- 2926 NW 21st St
- 2925 North Place
- 2121 N Brookline Ave
- 2934 North Place
- 2930 North Place
- 2924 NW 21st St
- 2923 North Place
- 3000 NW 21st St
- 2926 North Place
- 2922 NW 21st St
- 3005 North Place
- 3000 North Place
- 2919 North Place
- 3004 NW 21st St