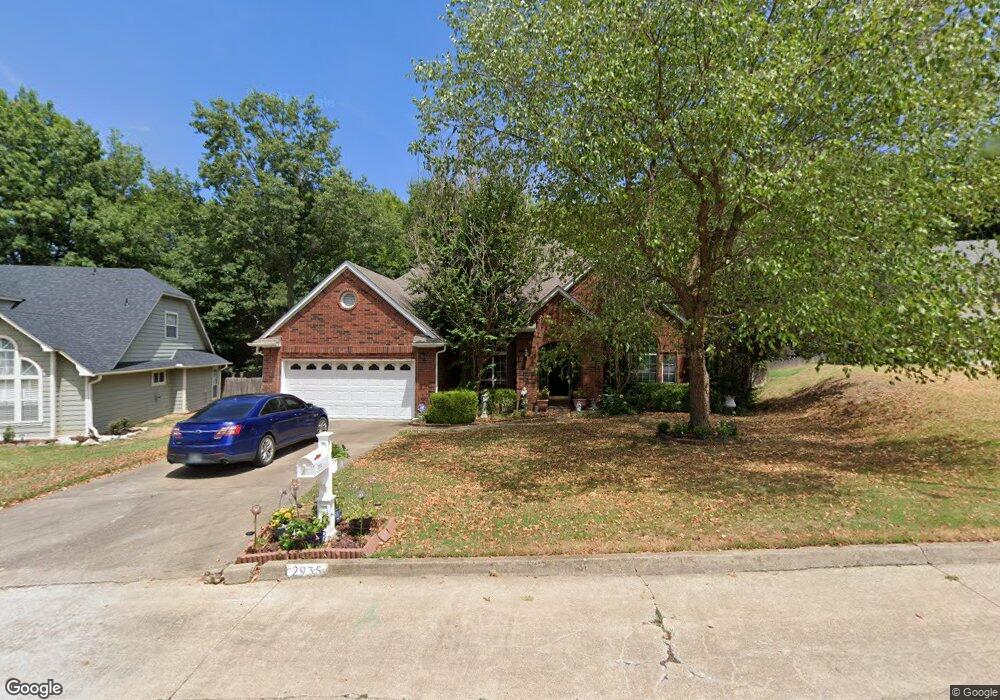
2935 W Berwick Claremore, OK 74017
Estimated Value: $256,752 - $284,000
3
Beds
2
Baths
1,871
Sq Ft
$142/Sq Ft
Est. Value
About This Home
This home is located at 2935 W Berwick, Claremore, OK 74017 and is currently estimated at $265,688, approximately $142 per square foot. 2935 W Berwick is a home located in Rogers County with nearby schools including Westside Elementary School, Will Rogers Junior High School, and Claremore High School.
Ownership History
Date
Name
Owned For
Owner Type
Purchase Details
Closed on
Feb 19, 2024
Sold by
Kay Edith Ann
Bought by
Kay Edith Ann and Allen Kathy Lynn
Current Estimated Value
Purchase Details
Closed on
Nov 3, 2023
Sold by
Kay Edith Ann
Bought by
Kay Edith Ann and Kay Debra Renee
Purchase Details
Closed on
Jun 20, 2007
Sold by
Gothard Rebecca L
Bought by
Kay Edith A
Home Financials for this Owner
Home Financials are based on the most recent Mortgage that was taken out on this home.
Original Mortgage
$141,000
Interest Rate
6.16%
Mortgage Type
New Conventional
Purchase Details
Closed on
Aug 13, 2004
Sold by
Quinn Marty L
Purchase Details
Closed on
Jul 27, 1995
Sold by
Hargrove Christopher A
Purchase Details
Closed on
Sep 2, 1994
Sold by
Crutchfield Brent M
Purchase Details
Closed on
Jun 1, 1992
Sold by
Mullica William Lee
Create a Home Valuation Report for This Property
The Home Valuation Report is an in-depth analysis detailing your home's value as well as a comparison with similar homes in the area
Home Values in the Area
Average Home Value in this Area
Purchase History
| Date | Buyer | Sale Price | Title Company |
|---|---|---|---|
| Kay Edith Ann | -- | None Listed On Document | |
| Kay Edith Ann | -- | None Listed On Document | |
| Kay Edith A | $157,000 | Land Title Closing Services | |
| -- | $140,000 | -- | |
| -- | $110,000 | -- | |
| -- | $109,000 | -- | |
| -- | $103,000 | -- |
Source: Public Records
Mortgage History
| Date | Status | Borrower | Loan Amount |
|---|---|---|---|
| Previous Owner | Kay Edith A | $141,000 |
Source: Public Records
Tax History Compared to Growth
Tax History
| Year | Tax Paid | Tax Assessment Tax Assessment Total Assessment is a certain percentage of the fair market value that is determined by local assessors to be the total taxable value of land and additions on the property. | Land | Improvement |
|---|---|---|---|---|
| 2025 | $1,498 | $17,202 | $3,720 | $13,482 |
| 2024 | $1,497 | $17,202 | $3,012 | $14,190 |
| 2023 | $1,497 | $17,202 | $3,551 | $13,651 |
| 2022 | $1,500 | $17,201 | $1,737 | $15,464 |
| 2021 | $1,431 | $17,202 | $1,691 | $15,511 |
| 2020 | $1,484 | $17,201 | $1,720 | $15,481 |
| 2019 | $1,501 | $17,202 | $1,796 | $15,406 |
| 2018 | $1,497 | $17,201 | $1,727 | $15,474 |
| 2017 | $1,488 | $17,202 | $1,742 | $15,460 |
| 2016 | $1,521 | $17,202 | $1,790 | $15,412 |
| 2015 | $1,502 | $17,202 | $1,841 | $15,361 |
| 2014 | $1,502 | $17,202 | $1,825 | $15,377 |
Source: Public Records
Map
Nearby Homes
- 511 Glencoe Cir
- 3112 W Berwick St
- 3011 W Berwick St
- 2701 Ridgeview Place
- 3103 Callaway Dr
- 2925 Holly Rd
- 612 Westwood Dr
- 2925 W Holly Hwy 20 Rd
- 3203 Callaway Dr
- 602 Rosewood Ct
- 2404 S Maywood Dr
- 2207 Pecan Chase Cir
- 3112 Club St
- 751 Christmas Ln
- 3206 Club St
- 2006 W Driftwood Dr
- 3311 Heritage Dr
- 3311 Fairway St
- 3327 Bunker St
- 3317 Fairway St
- 2933 W Berwick
- 2937 W Berwick
- 2809 Village Ct
- 2930 W Berwick St
- 2932 W Berwick St
- 2928 W Berwick St
- 2939 W Berwick
- 2931 W Berwick St
- 2807 Village Ct
- 512 Glencoe Cir
- 2926 W Berwick St
- 2934 W Berwick
- 2936 W Berwick St
- 2941 W Berwick
- 2929 W Berwick
- 510 Glencoe Cir
- 2924 W Berwick St
- 2927 W Berwick
- 2961 W Berwick St
- 514 Glencoe Cir