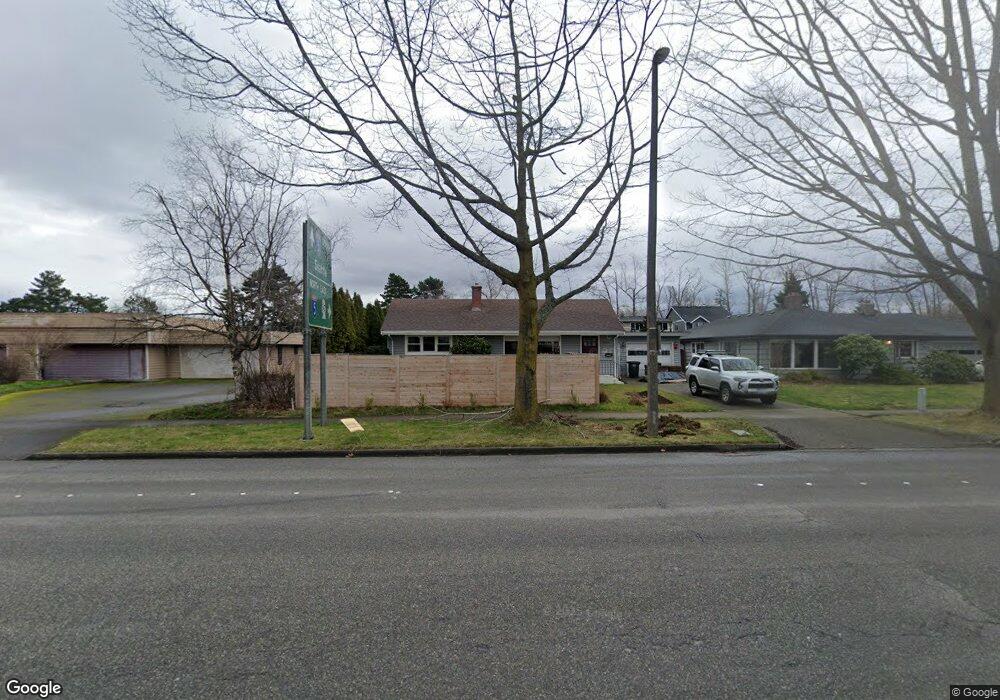
2936 James St Bellingham, WA 98225
Sunnyland NeighborhoodEstimated Value: $640,000 - $786,000
3
Beds
2
Baths
1,767
Sq Ft
$390/Sq Ft
Est. Value
About This Home
This home is located at 2936 James St, Bellingham, WA 98225 and is currently estimated at $689,344, approximately $390 per square foot. 2936 James St is a home located in Whatcom County with nearby schools including Sunnyland Elementary School, Whatcom Middle School, and Bellingham High School.
Ownership History
Date
Name
Owned For
Owner Type
Purchase Details
Closed on
Mar 9, 2022
Sold by
Lynne Farmer Janet
Bought by
Minehart Allison Marie Fieber and Minehart Timothy Benjamin
Current Estimated Value
Home Financials for this Owner
Home Financials are based on the most recent Mortgage that was taken out on this home.
Original Mortgage
$464,800
Outstanding Balance
$433,483
Interest Rate
3.76%
Mortgage Type
New Conventional
Estimated Equity
$255,861
Purchase Details
Closed on
Dec 4, 2018
Sold by
Farmer Govdam Dean
Bought by
Farmer Janet Lynne
Create a Home Valuation Report for This Property
The Home Valuation Report is an in-depth analysis detailing your home's value as well as a comparison with similar homes in the area
Home Values in the Area
Average Home Value in this Area
Purchase History
| Date | Buyer | Sale Price | Title Company |
|---|---|---|---|
| Minehart Allison Marie Fieber | $581,000 | Whatcom Land Title | |
| Farmer Janet Lynne | -- | None Available |
Source: Public Records
Mortgage History
| Date | Status | Borrower | Loan Amount |
|---|---|---|---|
| Open | Minehart Allison Marie Fieber | $464,800 |
Source: Public Records
Tax History Compared to Growth
Tax History
| Year | Tax Paid | Tax Assessment Tax Assessment Total Assessment is a certain percentage of the fair market value that is determined by local assessors to be the total taxable value of land and additions on the property. | Land | Improvement |
|---|---|---|---|---|
| 2024 | $4,899 | $613,885 | $215,516 | $398,369 |
| 2023 | $4,899 | $629,477 | $220,990 | $408,487 |
| 2022 | $3,701 | $502,101 | $190,512 | $311,589 |
| 2021 | $3,631 | $398,493 | $151,200 | $247,293 |
| 2020 | $3,521 | $368,975 | $140,000 | $228,975 |
| 2019 | $3,152 | $345,763 | $119,786 | $225,977 |
| 2018 | $3,174 | $310,367 | $107,546 | $202,821 |
| 2017 | $2,739 | $267,217 | $92,592 | $174,625 |
| 2016 | $2,396 | $240,959 | $83,088 | $157,871 |
| 2015 | $2,349 | $219,457 | $75,888 | $143,569 |
| 2014 | -- | $208,213 | $72,000 | $136,213 |
| 2013 | -- | $209,366 | $73,500 | $135,866 |
Source: Public Records
Map
Nearby Homes
- 607 E Illinois St
- 2929 Nevada St
- 2627 Iron St
- 3020 E North St
- 3024 E North St
- 1714 Sunup Loop
- 1716 Sunup Loop
- 1712 Sunup Loop
- 2430 Ellis St
- 1737 Sunup Loop
- 1735 Sunup Loop
- 1733 Sunup Loop
- 2500 Cornwall Ave
- 804 Gilbert Dr
- 2716 Sunset Dr
- 2873 Undine St
- 1812 E Maryland St
- 214 Carolina St
- 1813 Undine Ln
- 2518 S Park Dr