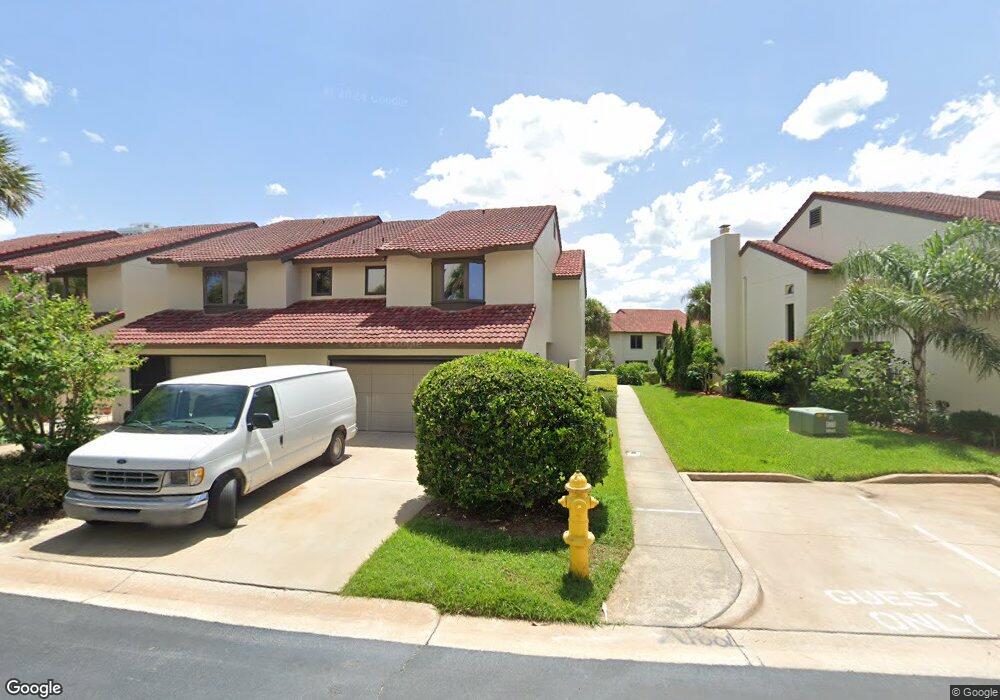
2936 Sea Oats Cir Daytona Beach, FL 32118
Estimated Value: $417,000 - $541,000
3
Beds
3
Baths
1,772
Sq Ft
$270/Sq Ft
Est. Value
About This Home
This home is located at 2936 Sea Oats Cir, Daytona Beach, FL 32118 and is currently estimated at $477,824, approximately $269 per square foot. 2936 Sea Oats Cir is a home with nearby schools including R.J. Longstreet Elementary School, Atlantic High School, and Silver Sands Middle School.
Ownership History
Date
Name
Owned For
Owner Type
Purchase Details
Closed on
Sep 22, 2025
Sold by
Teelon Charles W
Bought by
Teelon Charles W and Yeager Cindy L
Current Estimated Value
Purchase Details
Closed on
Oct 18, 2013
Sold by
Frascati Barbara A
Bought by
Teelon Charles W and Hart Janice G
Purchase Details
Closed on
Nov 14, 2003
Sold by
Kornberg Eli and Kornberg Mazal
Bought by
Frascati Barbara
Home Financials for this Owner
Home Financials are based on the most recent Mortgage that was taken out on this home.
Original Mortgage
$148,000
Interest Rate
5.75%
Purchase Details
Closed on
Aug 6, 1998
Sold by
Howell Robert J and Howell Bernardine E
Bought by
Komberg Eli and Komberg Mazai
Purchase Details
Closed on
Jan 16, 1995
Sold by
Marklow Edward J and Marklow Arloween K
Bought by
Howell Robert J and Howell Bernardine E
Purchase Details
Closed on
Jun 15, 1989
Bought by
Teelon Charels W
Create a Home Valuation Report for This Property
The Home Valuation Report is an in-depth analysis detailing your home's value as well as a comparison with similar homes in the area
Home Values in the Area
Average Home Value in this Area
Purchase History
| Date | Buyer | Sale Price | Title Company |
|---|---|---|---|
| Teelon Charles W | $229,000 | Attorney | |
| Frascati Barbara | $185,000 | -- | |
| Komberg Eli | $144,000 | -- | |
| Howell Robert J | $135,000 | -- | |
| Teelon Charels W | $138,000 | -- |
Source: Public Records
Mortgage History
| Date | Status | Borrower | Loan Amount |
|---|---|---|---|
| Previous Owner | Frascati Barbara | $148,000 |
Source: Public Records
Tax History Compared to Growth
Tax History
| Year | Tax Paid | Tax Assessment Tax Assessment Total Assessment is a certain percentage of the fair market value that is determined by local assessors to be the total taxable value of land and additions on the property. | Land | Improvement |
|---|---|---|---|---|
| 2025 | $5,038 | $386,493 | $123,500 | $262,993 |
| 2024 | $5,038 | $348,279 | $103,500 | $244,779 |
| 2023 | $5,038 | $330,536 | $90,000 | $240,536 |
| 2022 | $4,574 | $286,397 | $60,000 | $226,397 |
| 2021 | $4,321 | $233,514 | $57,100 | $176,414 |
| 2020 | $4,583 | $225,161 | $55,500 | $169,661 |
| 2019 | $4,404 | $214,227 | $55,500 | $158,727 |
| 2018 | $4,178 | $199,703 | $60,000 | $139,703 |
| 2017 | $4,370 | $201,325 | $60,000 | $141,325 |
| 2016 | $4,438 | $197,720 | $0 | $0 |
| 2015 | $4,667 | $197,007 | $0 | $0 |
| 2014 | $4,637 | $189,934 | $0 | $0 |
Source: Public Records
Map
Nearby Homes
- 2964 Oceans Trace
- 2966 Oceans Trace
- 2942 Sea Oats Cir
- 2932 Sea Oats Cir
- 2934 Oceans Trace
- 3 Oceans Blvd W Unit 4B6
- 3 Oceans Blvd W Unit 7C6
- 3 Oceans Blvd W Unit 5B4
- 3 Oceans Blvd W Unit 3A7
- 3 Oceans Blvd W Unit 2A4
- 3 Oceans Blvd W Unit 1D6
- 3 Oceans Blvd W Unit 4B7
- 3 Oceans West Blvd Unit 7D2
- 2937 S Atlantic Ave Unit 2002
- 2937 S Atlantic Ave Unit 703
- 2937 S Atlantic Ave Unit 1907
- 2937 S Atlantic Ave Unit 1002
- 2937 S Atlantic Ave Unit 902
- 2937 S Atlantic Ave Unit 2103
- 2937 S Atlantic Ave Unit 1504
- 2938 Sea Oats Cir
- 2940 Sea Oats Cir
- 2934 Sea Oats Cir
- 2944 Sea Oats Cir
- 2946 Sea Oats Cir
- 2947 Oceans Trace
- 2949 Oceans Trace
- 2930 Sea Oats Cir
- 2945 Oceans Trace
- 2928 Sea Oats Cir
- 2943 Oceans Trace
- 2951 Oceans Trace
- 2226 S Atlantic Ave
- 3411 S Atlantic Ave
- 3830 S Atlantic Ave
- 3159 S Atlantic Ave
- 3780 S Atlantic Ave
- 3818 S Atlantic Ave
- 2024 S Atlantic Ave
- 2038 S Atlantic Ave