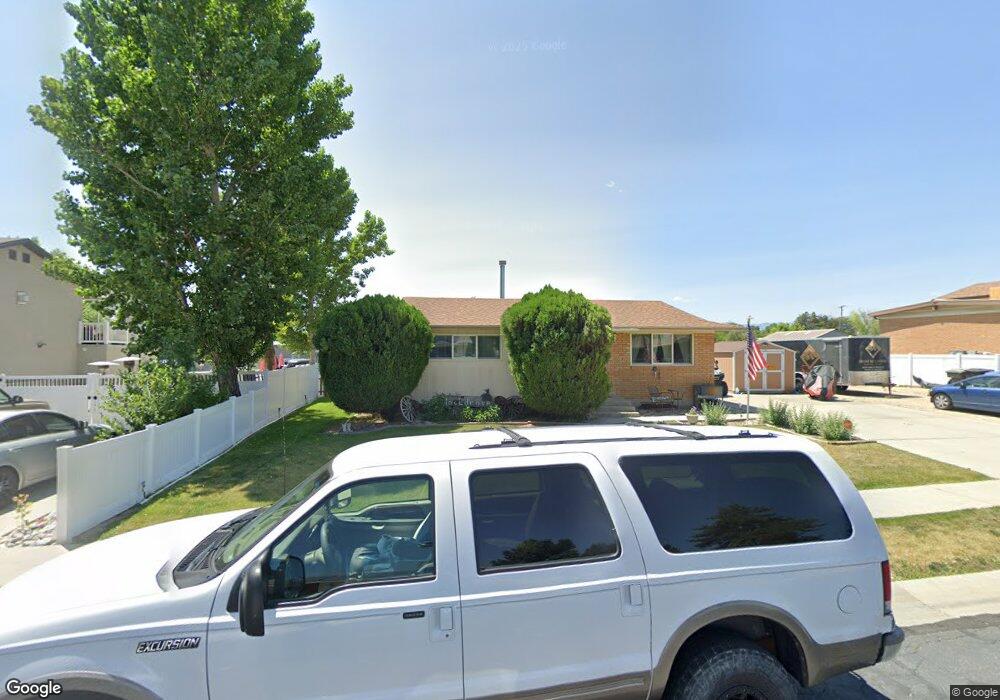
2937 W 7268 S West Jordan, UT 84084
Estimated Value: $492,000 - $541,000
4
Beds
2
Baths
986
Sq Ft
$524/Sq Ft
Est. Value
About This Home
This home is located at 2937 W 7268 S, West Jordan, UT 84084 and is currently estimated at $516,351, approximately $523 per square foot. 2937 W 7268 S is a home located in Salt Lake County with nearby schools including Westland Elementary School, West Jordan Middle School, and West Jordan High School.
Ownership History
Date
Name
Owned For
Owner Type
Purchase Details
Closed on
Aug 12, 2015
Sold by
Babbel Stven E and Babbel Susan A
Bought by
Babbel Steven E and Babbel Susan A
Current Estimated Value
Purchase Details
Closed on
Sep 8, 2010
Sold by
Babbel Steven E
Bought by
Babbel R Steven E and Babbel Susan A
Purchase Details
Closed on
Mar 13, 2008
Sold by
Babbel Steven E
Bought by
Babbel Steven E and Babbel Susan A
Purchase Details
Closed on
Feb 23, 1998
Sold by
Wood Steven Lynn and Wood Nanette C
Bought by
Babbel Steven E
Home Financials for this Owner
Home Financials are based on the most recent Mortgage that was taken out on this home.
Original Mortgage
$131,580
Interest Rate
6.97%
Mortgage Type
VA
Create a Home Valuation Report for This Property
The Home Valuation Report is an in-depth analysis detailing your home's value as well as a comparison with similar homes in the area
Home Values in the Area
Average Home Value in this Area
Purchase History
| Date | Buyer | Sale Price | Title Company |
|---|---|---|---|
| Babbel Steven E | -- | None Available | |
| Babbel R Steven E | -- | Beehive Title Ins Agcy Lc | |
| Babbel R Steven E | -- | Beehive Title Ins Agcy Lc | |
| Babbel Steven E | -- | Independence Title | |
| Babbel Steven E | -- | -- |
Source: Public Records
Mortgage History
| Date | Status | Borrower | Loan Amount |
|---|---|---|---|
| Previous Owner | Babbel Steven E | $131,580 |
Source: Public Records
Tax History Compared to Growth
Tax History
| Year | Tax Paid | Tax Assessment Tax Assessment Total Assessment is a certain percentage of the fair market value that is determined by local assessors to be the total taxable value of land and additions on the property. | Land | Improvement |
|---|---|---|---|---|
| 2025 | $2,336 | $484,700 | $207,500 | $277,200 |
| 2024 | $2,336 | $449,400 | $199,500 | $249,900 |
| 2023 | $2,375 | $430,600 | $197,500 | $233,100 |
| 2022 | $2,424 | $432,400 | $193,700 | $238,700 |
| 2021 | $1,930 | $313,400 | $161,400 | $152,000 |
| 2020 | $1,936 | $295,100 | $161,400 | $133,700 |
| 2019 | $1,882 | $281,200 | $135,600 | $145,600 |
| 2018 | $1,683 | $249,400 | $126,300 | $123,100 |
| 2017 | $1,572 | $232,000 | $126,300 | $105,700 |
| 2016 | $1,493 | $207,000 | $126,300 | $80,700 |
| 2015 | $1,556 | $210,300 | $128,600 | $81,700 |
| 2014 | $1,421 | $189,100 | $116,600 | $72,500 |
Source: Public Records
Map
Nearby Homes
- 7361 S 2700 W
- 2886 W 7550 S
- 8524 S Michele River Ave W Unit 109
- 7604 S Autumn Dr
- 2573 Jordan Meadows Ln
- 7642 S 2700 W
- 2510 W Jordan Meadows Ln
- 7721 Sunset Cir
- 6893 S 3200 W
- 6918 S Harvest Cir
- 7611 S Springbrook Dr
- 3165 W 7720 S
- 7647 S 2500 W
- 7122 S Wood Green Rd
- 2312 W Hidden Bend Cove Unit 107
- 3383 W 6880 S
- 3354 W 7800 S
- 2421 W 6900 S
- 3422 Briar Dr
- 2683 W Carson Ln
- 2937 W 7268 S
- 2929 W 7268 S
- 2949 W 7268 S
- 2929 W 7268 S
- 2955 W 7268 S
- 2915 W 7268 S
- 2940 Leisure Cir
- 7275 S 2950 W
- 2908 Leisure Cir
- 2920 W 7268 S
- 2934 W 7268 S
- 7262 S 2950 W
- 2901 W 7268 S
- 2900 W Leisure Cir Unit 10
- 2906 W 7268 S
- 2892 Leisure Cir
- 7256 S 2950 W
- 2954 Leisure Cir
- 2894 W 7268 S
- 2894 W 7268 S