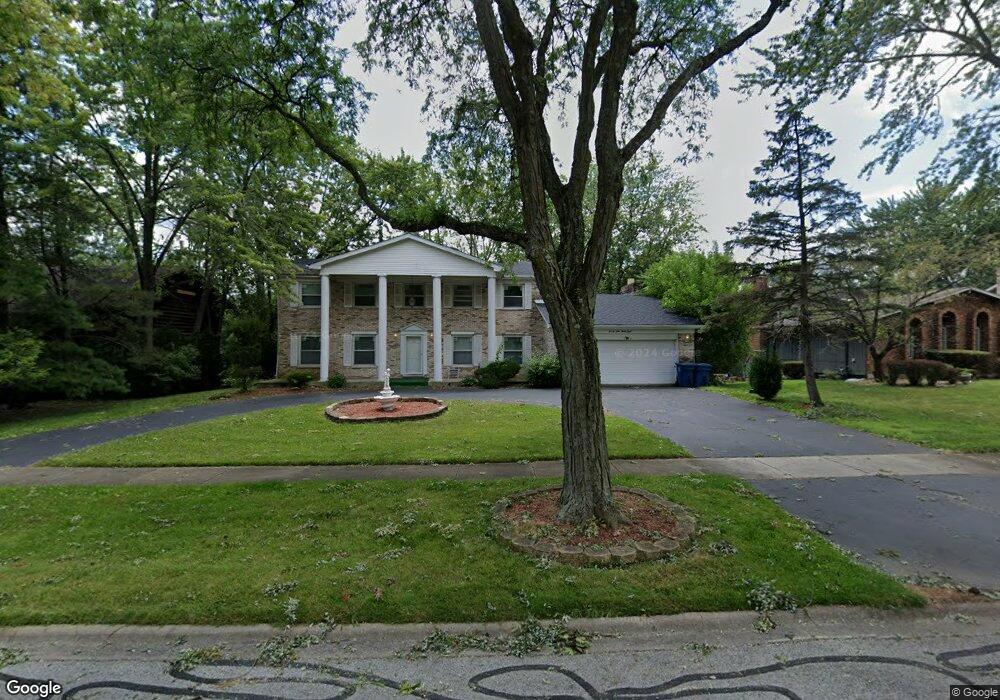
2938 Alexander Crescent Unit 5 Flossmoor, IL 60422
Estimated Value: $354,000 - $419,000
5
Beds
4
Baths
2,844
Sq Ft
$140/Sq Ft
Est. Value
About This Home
This home is located at 2938 Alexander Crescent Unit 5, Flossmoor, IL 60422 and is currently estimated at $398,742, approximately $140 per square foot. 2938 Alexander Crescent Unit 5 is a home located in Cook County with nearby schools including Heather Hill Elementary School, Parker Junior High School, and Homewood-Flossmoor High School.
Ownership History
Date
Name
Owned For
Owner Type
Purchase Details
Closed on
Dec 31, 2017
Sold by
Lewis Monica A
Bought by
Howard Edgar Lee
Current Estimated Value
Purchase Details
Closed on
Dec 10, 2007
Sold by
Howard Edgar L
Bought by
Howard Edgar L and Lewis Howard Monica
Purchase Details
Closed on
Jul 17, 2007
Sold by
Lewis Howard Monica
Bought by
Howard Monica
Purchase Details
Closed on
Dec 9, 2005
Sold by
Howard Edgar L
Bought by
Howard Edgar L and Lewis Howard Monica
Purchase Details
Closed on
Sep 30, 1997
Sold by
Mon Richard L and Mon Leilanie N
Bought by
Howard Edgar L
Home Financials for this Owner
Home Financials are based on the most recent Mortgage that was taken out on this home.
Original Mortgage
$170,900
Interest Rate
10.74%
Create a Home Valuation Report for This Property
The Home Valuation Report is an in-depth analysis detailing your home's value as well as a comparison with similar homes in the area
Home Values in the Area
Average Home Value in this Area
Purchase History
| Date | Buyer | Sale Price | Title Company |
|---|---|---|---|
| Howard Edgar Lee | -- | None Available | |
| Howard Edgar L | -- | None Available | |
| Howard Monica | -- | Pacific Northwest Title | |
| Howard Edgar L | -- | -- | |
| Howard Edgar L | $126,666 | Attorneys Natl Title Network |
Source: Public Records
Mortgage History
| Date | Status | Borrower | Loan Amount |
|---|---|---|---|
| Previous Owner | Howard Edgar L | $170,900 |
Source: Public Records
Tax History Compared to Growth
Tax History
| Year | Tax Paid | Tax Assessment Tax Assessment Total Assessment is a certain percentage of the fair market value that is determined by local assessors to be the total taxable value of land and additions on the property. | Land | Improvement |
|---|---|---|---|---|
| 2024 | $11,358 | $30,000 | $7,186 | $22,814 |
| 2023 | $9,475 | $30,000 | $7,186 | $22,814 |
| 2022 | $9,475 | $21,037 | $6,206 | $14,831 |
| 2021 | $9,540 | $21,036 | $6,205 | $14,831 |
| 2020 | $9,257 | $21,036 | $6,205 | $14,831 |
| 2019 | $10,922 | $23,697 | $5,552 | $18,145 |
| 2018 | $10,508 | $23,697 | $5,552 | $18,145 |
| 2017 | $10,348 | $23,697 | $5,552 | $18,145 |
| 2016 | $10,663 | $22,631 | $4,899 | $17,732 |
| 2015 | $10,647 | $22,631 | $4,899 | $17,732 |
| 2014 | $10,475 | $22,631 | $4,899 | $17,732 |
| 2013 | $10,282 | $24,149 | $4,899 | $19,250 |
Source: Public Records
Map
Nearby Homes
- 2937 Kathleen Ln
- 3013 Mac Heath Crescent
- 1402 Berry Ln
- 3045 Scott Crescent
- 1833 Pheasant Ct
- 1248 Berry Ln
- 1450 Tanglewood St Unit 1B
- 1248 Oakmont Ave
- 3232 Chestnut Dr
- 2904 Athena Ct
- 2908 Athena Ct
- 20015 Delphi Dr
- 3118 Elaine Ct Unit 232
- 2931 Sunset Ave
- 3037 Candlewood Ct
- 1430 Brassie Ave
- 1141 Leavitt Ave Unit 115
- 1139 Leavitt Ave Unit 212
- 1139 Leavitt Ave Unit 313
- 2929 Flossmoor Rd
- 2944 Alexander Crescent
- 2930 Alexander Crescent
- 2931 Kathleen Ln
- 2925 Kathleen Ln
- 2952 Alexander Crescent
- 2922 Alexander Crescent
- 2931 Alexander Crescent Unit 9
- 2935 Alexander Crescent
- 2943 Kathleen Ln
- 2919 Kathleen Ln
- 2949 Alexander Crescent
- 3004 Alexander Crescent
- 2923 Alexander Crescent
- 2916 Alexander Crescent
- 2939 Alexander Crescent
- 3001 Kathleen Ln
- 2945 Alexander Crescent
- 3012 Alexander Crescent
- 2928 Kathleen Ln