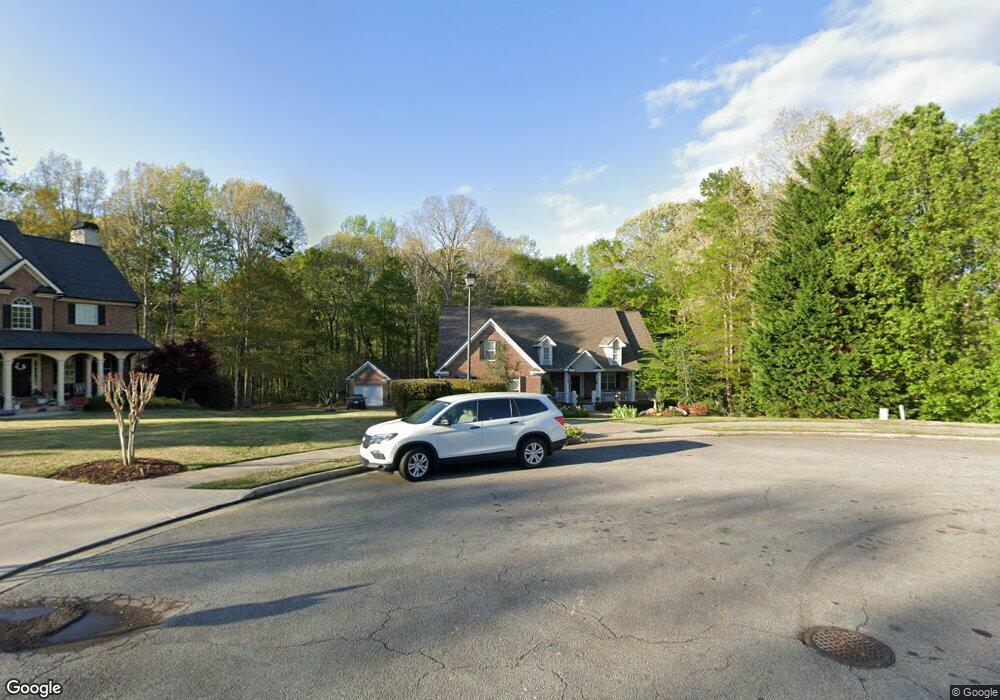
2938 Judicial Place Unit 1 Buford, GA 30519
Estimated Value: $572,000 - $633,000
3
Beds
4
Baths
2,980
Sq Ft
$207/Sq Ft
Est. Value
About This Home
This home is located at 2938 Judicial Place Unit 1, Buford, GA 30519 and is currently estimated at $616,140, approximately $206 per square foot. 2938 Judicial Place Unit 1 is a home located in Hall County with nearby schools including Friendship Elementary School, Cherokee Bluff Middle School, and Cherokee Bluff High School.
Ownership History
Date
Name
Owned For
Owner Type
Purchase Details
Closed on
Feb 14, 2023
Sold by
Crone Linda
Bought by
Crone Linda Ellen and Linda Ellen Crone Liv Rev Tr
Current Estimated Value
Purchase Details
Closed on
Oct 28, 2005
Sold by
Crone Donald L
Bought by
Crone Donald L and Crone Linda
Home Financials for this Owner
Home Financials are based on the most recent Mortgage that was taken out on this home.
Original Mortgage
$280,000
Interest Rate
5.76%
Mortgage Type
New Conventional
Purchase Details
Closed on
Sep 25, 2002
Sold by
Jordan-Hunter Llc
Bought by
Rost Mark W and Rost Jeanne M
Home Financials for this Owner
Home Financials are based on the most recent Mortgage that was taken out on this home.
Original Mortgage
$125,000
Interest Rate
6.27%
Mortgage Type
New Conventional
Purchase Details
Closed on
Feb 11, 2002
Sold by
Chateau Corners Development Corp
Bought by
Jordan-Hunter Llc
Create a Home Valuation Report for This Property
The Home Valuation Report is an in-depth analysis detailing your home's value as well as a comparison with similar homes in the area
Home Values in the Area
Average Home Value in this Area
Purchase History
| Date | Buyer | Sale Price | Title Company |
|---|---|---|---|
| Crone Linda Ellen | -- | -- | |
| Crone Donald L | -- | -- | |
| Crone Donald L | $350,000 | -- | |
| Landamerica Onestop Inc | $350,000 | -- | |
| Rost Mark W | $304,400 | -- | |
| Jordan-Hunter Llc | $792,000 | -- |
Source: Public Records
Mortgage History
| Date | Status | Borrower | Loan Amount |
|---|---|---|---|
| Previous Owner | Landamerica Onestop Inc | $280,000 | |
| Previous Owner | Landamerica Onestop Inc | $35,000 | |
| Previous Owner | Rost Mark W | $125,000 |
Source: Public Records
Tax History Compared to Growth
Tax History
| Year | Tax Paid | Tax Assessment Tax Assessment Total Assessment is a certain percentage of the fair market value that is determined by local assessors to be the total taxable value of land and additions on the property. | Land | Improvement |
|---|---|---|---|---|
| 2024 | $2,167 | $251,920 | $66,600 | $185,320 |
| 2023 | $1,441 | $188,444 | $29,200 | $159,244 |
| 2022 | $1,598 | $176,560 | $27,600 | $148,960 |
| 2021 | $1,458 | $153,080 | $17,000 | $136,080 |
| 2020 | $1,442 | $148,120 | $17,000 | $131,120 |
| 2019 | $1,406 | $141,040 | $16,000 | $125,040 |
| 2018 | $1,468 | $143,520 | $16,000 | $127,520 |
| 2017 | $1,469 | $138,240 | $13,880 | $124,360 |
| 2016 | $1,165 | $120,952 | $13,912 | $107,040 |
| 2015 | $3,334 | $120,952 | $13,912 | $107,040 |
| 2014 | $3,334 | $117,708 | $13,912 | $103,795 |
Source: Public Records
Map
Nearby Homes
- 2228 Mayors Way
- 2638 Democracy Dr Unit 1
- 7235 Coral Lake Dr
- Sierra Plan at Sherwood Square
- Sawnee Plan at Sherwood Square
- 7289 Mulberry Trace Ln Unit LOT 178
- 7296 Mulberry Trace Ln Unit LOT 180
- 7296 Mulberry Trace Ln
- 7300 Mulberry Trace Ln
- 7300 Mulberry Trace Ln Unit LOT 181
- 7304 Mulberry Trace Ln Unit LOT 182
- 7304 Mulberry Trace Ln
- 7308 Mulberry Trace Ln Unit LOT 183
- 7308 Mulberry Trace Ln
- 7312 Mulberry Trace Ln Unit LOT 184
- 7312 Mulberry Trace Ln
- 7316 Mulberry Trace Ln
- 7316 Mulberry Trace Ln Unit LOT 185
- 7207 Spout Springs Rd
- 7320 Mulberry Trace Ln Unit LOT 186
- 2942 Judicial Place
- 2922 Legislative Ln
- 2932 Judicial Place Unit 44
- 2932 Judicial Place Unit 1
- 2916 Legislative Ln
- 2939 Judicial Place
- 2954 Legislative Ln
- 2958 Legislative Ln Unit 2958
- 2958 Legislative Ln
- 2958 Legislative Ln
- 2923 Legislative Ln Unit 1
- 2911 Legislative Ln
- 2927 Legislative Ln
- 2910 Legislative Ln Unit 1
- 2223 Mayors Way
- 2955 Legislative Ln Unit 1
- 2962 Legislative Ln
- 2901 Legislative Ln
- 2003 Democracy Dr
- 2853 Senator Ct