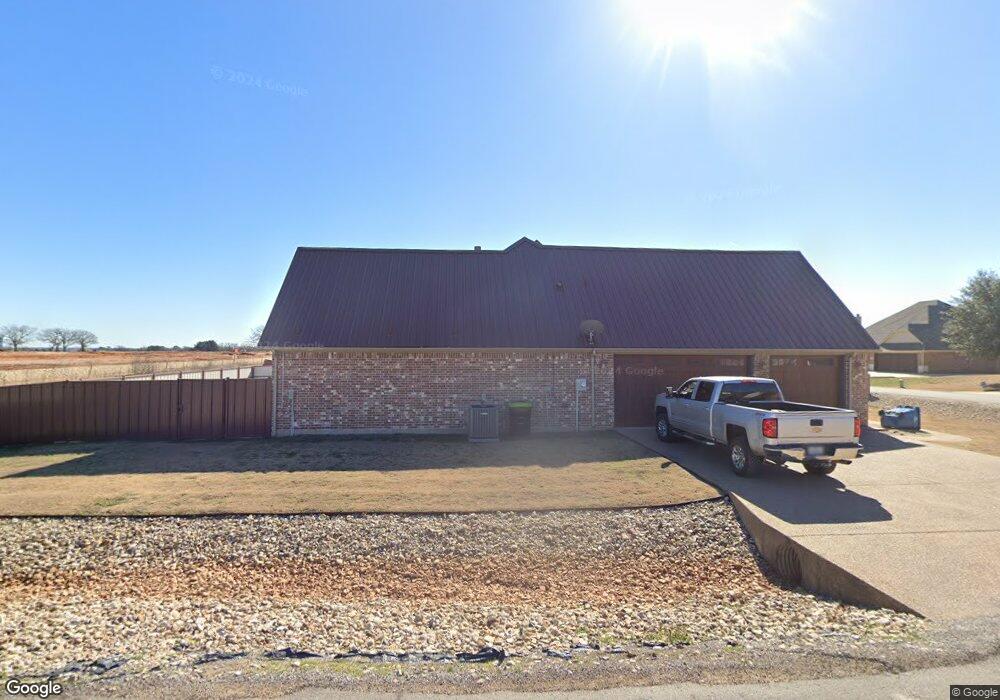
2938 Willow Ridge Cir Granbury, TX 76049
Estimated Value: $378,000 - $458,000
4
Beds
2
Baths
1,897
Sq Ft
$218/Sq Ft
Est. Value
About This Home
This home is located at 2938 Willow Ridge Cir, Granbury, TX 76049 and is currently estimated at $413,493, approximately $217 per square foot. 2938 Willow Ridge Cir is a home located in Hood County with nearby schools including Acton Elementary School, Acton Middle School, and Granbury High School.
Ownership History
Date
Name
Owned For
Owner Type
Purchase Details
Closed on
Nov 14, 2022
Sold by
Mark W Cordell Trust
Bought by
Julie A Cordell Family Living Trust
Current Estimated Value
Purchase Details
Closed on
Jul 8, 2009
Sold by
Cordell Construction Inc
Bought by
Cordell Mark W Trust & Cordell Patricia R Tru
Purchase Details
Closed on
Jun 29, 2009
Sold by
Cordell Construction Inc
Bought by
Mark W & Patricia R Cordell Trust
Purchase Details
Closed on
Apr 18, 2008
Sold by
Cordell Julie A
Bought by
Cordell Mark W Trust & Cordell Patricia R Tru
Purchase Details
Closed on
Feb 29, 2008
Sold by
Tri-County Development Inc
Bought by
Cordell Mark W Trust & Cordell Patricia R Tru
Purchase Details
Closed on
Jan 21, 2005
Sold by
Tri-County Development Inc
Bought by
Cordell Mark W Trust & Cordell Patricia R Tru
Create a Home Valuation Report for This Property
The Home Valuation Report is an in-depth analysis detailing your home's value as well as a comparison with similar homes in the area
Home Values in the Area
Average Home Value in this Area
Purchase History
| Date | Buyer | Sale Price | Title Company |
|---|---|---|---|
| Julie A Cordell Family Living Trust | -- | -- | |
| Cordell Mark W Trust & Cordell Patricia R Tru | -- | -- | |
| Mark W & Patricia R Cordell Trust | -- | Stc | |
| Cordell Mark W Trust & Cordell Patricia R Tru | -- | -- | |
| Cordell Mark W Trust & Cordell Patricia R Tru | -- | -- | |
| Cordell Mark W Trust & Cordell Patricia R Tru | -- | -- |
Source: Public Records
Mortgage History
| Date | Status | Borrower | Loan Amount |
|---|---|---|---|
| Closed | Mark W & Patricia R Cordell Trust | $0 |
Source: Public Records
Tax History Compared to Growth
Tax History
| Year | Tax Paid | Tax Assessment Tax Assessment Total Assessment is a certain percentage of the fair market value that is determined by local assessors to be the total taxable value of land and additions on the property. | Land | Improvement |
|---|---|---|---|---|
| 2025 | $3,378 | $373,720 | $40,000 | $333,720 |
| 2024 | $4,642 | $381,510 | $40,000 | $341,510 |
| 2023 | $4,690 | $385,400 | $40,000 | $345,400 |
| 2022 | $4,596 | $345,350 | $30,000 | $315,350 |
| 2021 | $3,914 | $254,980 | $30,000 | $224,980 |
| 2020 | $4,002 | $257,660 | $30,000 | $227,660 |
| 2019 | $3,782 | $232,660 | $30,000 | $202,660 |
| 2018 | $3,439 | $211,550 | $30,000 | $181,550 |
| 2017 | $3,455 | $206,620 | $30,000 | $176,620 |
| 2016 | $3,287 | $196,580 | $30,000 | $166,580 |
| 2015 | $3,027 | $207,820 | $30,000 | $177,820 |
| 2014 | $3,027 | $182,710 | $30,000 | $152,710 |
Source: Public Records
Map
Nearby Homes
- 2936 Willow Ridge Cir
- 1141 Avery Rd
- 1144 Avery Rd
- 1136 Avery Rd
- 2925 Willow Ridge Cir
- 2918 Willow Ridge Cir
- 2918 James Rd
- 4363 Acton Hwy
- 3510 Fountain Way
- 4920 Centre Ct
- 3218 Fountain Way
- 1301 James Rd
- 2180 James Rd
- 4410 Halo Ct
- 2608 Royal Ln
- 4512 Cimmaron Trail
- 5700 N Highland Dr
- 5003 Bueno Dr
- 2445 Bob White Dr
- 3707 Bob White Dr
- 2719 Willow Ridge Cir
- 2934 Willow Ridge Cir
- 2718 Willow Ridge Cir
- 2720 Willow Ridge Cir
- 2935 Willow Ridge Cir
- 2800 Willow Ridge Cir
- 2932 Willow Ridge Cir
- 2933 Willow Ridge Cir
- 2802 Willow Ridge Cir
- 2813 Willow Ridge Cir
- 2930 Willow Ridge Cir
- 2931 Willow Ridge Cir
- 2804 Willow Ridge Cir
- 2815 Willow Ridge Cir
- 2929 Willow Ridge Cir
- 2928 Willow Ridge Cir
- 2817 Willow Ridge Cir
- 2806 Willow Ridge Cir
- 2819 Willow Ridge Cir
- 2814 Willow Ridge Cir