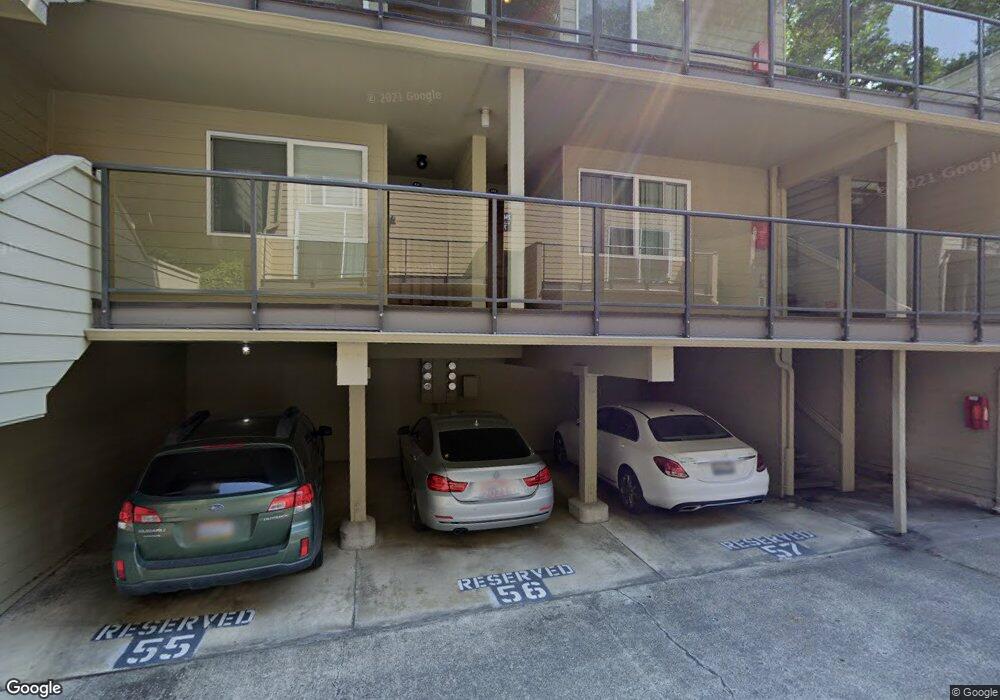
2939 76th Ave SE Unit 41A Mercer Island, WA 98040
Downtown Mercer Island NeighborhoodEstimated Value: $287,000 - $338,000
--
Bed
1
Bath
455
Sq Ft
$664/Sq Ft
Est. Value
About This Home
This home is located at 2939 76th Ave SE Unit 41A, Mercer Island, WA 98040 and is currently estimated at $302,057, approximately $663 per square foot. 2939 76th Ave SE Unit 41A is a home located in King County with nearby schools including West Mercer Elementary School, Islander Middle School, and Mercer Island High School.
Ownership History
Date
Name
Owned For
Owner Type
Purchase Details
Closed on
Apr 17, 2025
Sold by
Lee Young Wor and Lee Elaine Xue
Bought by
Zhao Xuefang
Current Estimated Value
Home Financials for this Owner
Home Financials are based on the most recent Mortgage that was taken out on this home.
Original Mortgage
$174,000
Outstanding Balance
$173,225
Interest Rate
6.63%
Mortgage Type
New Conventional
Estimated Equity
$128,832
Purchase Details
Closed on
Apr 16, 2025
Sold by
Nie Jinhan
Bought by
Zhao Xuefang
Home Financials for this Owner
Home Financials are based on the most recent Mortgage that was taken out on this home.
Original Mortgage
$174,000
Outstanding Balance
$173,225
Interest Rate
6.63%
Mortgage Type
New Conventional
Estimated Equity
$128,832
Purchase Details
Closed on
Oct 22, 2014
Sold by
Pearl Sanford D
Bought by
Lee Young Wor and Lee Elaine Xue
Purchase Details
Closed on
Jul 28, 1992
Sold by
Wicklund Lee A
Bought by
Pearl Sanford D
Create a Home Valuation Report for This Property
The Home Valuation Report is an in-depth analysis detailing your home's value as well as a comparison with similar homes in the area
Home Values in the Area
Average Home Value in this Area
Purchase History
| Date | Buyer | Sale Price | Title Company |
|---|---|---|---|
| Zhao Xuefang | $290,000 | First American Title | |
| Zhao Xuefang | $313 | First American Title | |
| Lee Young Wor | $135,000 | Chicago Title | |
| Pearl Sanford D | $41,000 | -- |
Source: Public Records
Mortgage History
| Date | Status | Borrower | Loan Amount |
|---|---|---|---|
| Open | Zhao Xuefang | $174,000 |
Source: Public Records
Tax History Compared to Growth
Tax History
| Year | Tax Paid | Tax Assessment Tax Assessment Total Assessment is a certain percentage of the fair market value that is determined by local assessors to be the total taxable value of land and additions on the property. | Land | Improvement |
|---|---|---|---|---|
| 2024 | $1,982 | $300,000 | $67,100 | $232,900 |
| 2023 | $1,765 | $300,000 | $66,300 | $233,700 |
| 2022 | $1,754 | $285,000 | $64,600 | $220,400 |
| 2021 | $2,033 | $236,000 | $64,600 | $171,400 |
| 2020 | $2,077 | $252,000 | $64,600 | $187,400 |
| 2018 | $1,764 | $243,000 | $64,600 | $178,400 |
| 2017 | $1,314 | $202,000 | $64,600 | $137,400 |
| 2016 | $1,240 | $160,000 | $64,600 | $95,400 |
| 2015 | $1,298 | $147,000 | $64,600 | $82,400 |
| 2014 | -- | $147,000 | $62,900 | $84,100 |
| 2013 | -- | $113,000 | $62,900 | $50,100 |
Source: Public Records
Map
Nearby Homes
- 2949 76th Ave SE Unit 81D
- 2918 74th Ave SE
- 2920 76th Ave SE Unit 411
- 2965 74th Ave SE
- 7600 SE 29th St Unit A501
- 3055 80th Ave SE Unit 107
- 7930 SE 34th St Unit 513
- 6950 SE Maker St
- 7800 SE 27th St Unit 503
- 28 XX 68th Ave SE
- 73 xx SE 38th St
- 7929 SE 37th St
- 3639 W Mercer Way
- 8351 SE 31st St
- 2440 64th Ave SE
- 2236 66th Ave SE
- 8428 N Mercer Way
- 3706 84th Ave SE
- 7254 N Mercer Way
- 4150 Boulevard Place
- 2939 76th Ave SE Unit 41B
- 2937 76th Ave SE Unit 31C
- 2939 76th Ave SE Unit 42B
- 2939 76th Ave SE Unit 41-D
- 2937 76th Ave SE Unit 33D
- 2939 76th Ave SE Unit 43C
- 2939 76th Ave SE Unit 42-A
- 2939 76th Ave SE Unit 43B
- 2939 76th Ave SE
- 2939 76th Ave SE Unit 43A
- 2937 76th Ave SE Unit 33A
- 2937 76th Ave SE Unit D31
- 2937 76th Ave SE Unit 33C
- 2939 76th Ave SE Unit 43D
- 2937 76th Ave SE Unit 31D
- 2939 76th Ave SE Unit 42C
- 2933 76th Ave SE
- 2933 76th Ave SE Unit 41C
- 2933 76th Ave SE Unit 92B
- 2933 76th Ave SE Unit 31A