Estimated Value: $52,000 - $113,000
3
Beds
1
Bath
1,204
Sq Ft
$77/Sq Ft
Est. Value
About This Home
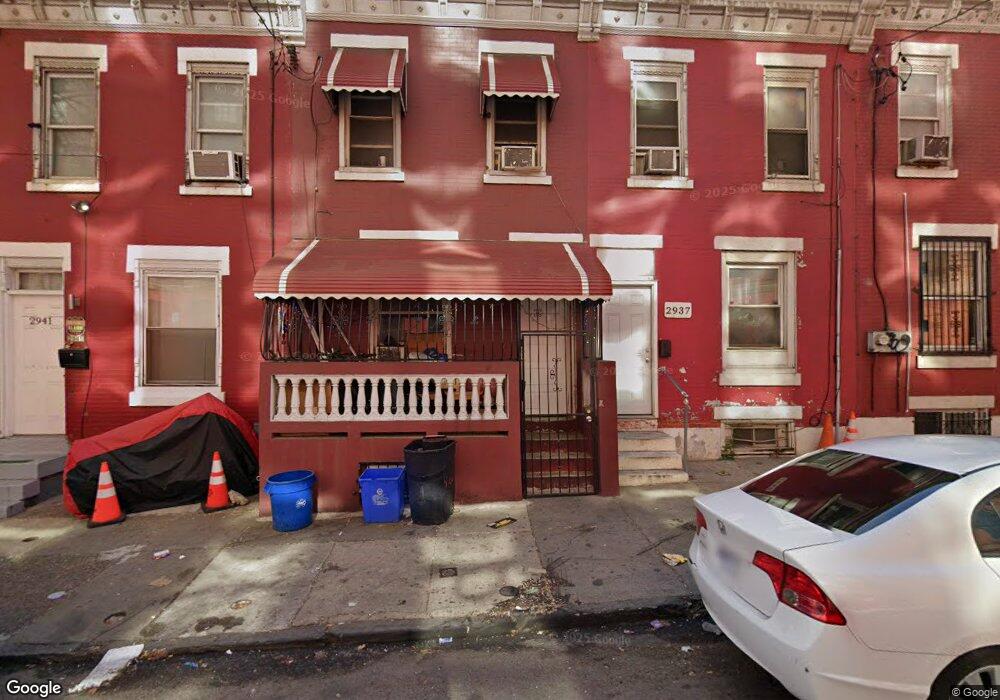
This home is located at 2939 A St, Philadelphia, PA 19134 and is currently estimated at $92,851, approximately $77 per square foot. 2939 A St is a home located in Philadelphia County with nearby schools including Elkin Lewis School, Thomas Alva Edison High School/Fareira Skills Center, and John B. Stetson Charter School.
Ownership History
Date
Name
Owned For
Owner Type
Purchase Details
Closed on
Mar 4, 2013
Sold by
Gonzalez David Perez and Gonzalez Mildred
Bought by
Loperena Maribel
Current Estimated Value
Purchase Details
Closed on
May 7, 1999
Sold by
Metro Group Properties Inc
Bought by
Perez David and Gonzalez Mildred
Purchase Details
Closed on
Feb 22, 1999
Sold by
Ocwen Federal Bank Fsb
Bought by
Metro Group Properties Inc
Purchase Details
Closed on
Jan 11, 1999
Sold by
Fantazzia James and Fantazzia Denise L
Bought by
Ocwen Federal Bank Fsb
Create a Home Valuation Report for This Property
The Home Valuation Report is an in-depth analysis detailing your home's value as well as a comparison with similar homes in the area
Home Values in the Area
Average Home Value in this Area
Purchase History
| Date | Buyer | Sale Price | Title Company |
|---|---|---|---|
| Loperena Maribel | -- | None Available | |
| Perez David | $32,000 | Security Search & Abstract C | |
| Metro Group Properties Inc | $4,000 | -- | |
| Ocwen Federal Bank Fsb | $5,400 | -- |
Source: Public Records
Tax History Compared to Growth
Tax History
| Year | Tax Paid | Tax Assessment Tax Assessment Total Assessment is a certain percentage of the fair market value that is determined by local assessors to be the total taxable value of land and additions on the property. | Land | Improvement |
|---|---|---|---|---|
| 2025 | $893 | $77,700 | $15,500 | $62,200 |
| 2024 | $893 | $77,700 | $15,500 | $62,200 |
| 2023 | $893 | $63,800 | $12,760 | $51,040 |
| 2022 | $309 | $63,800 | $12,760 | $51,040 |
| 2021 | $309 | $0 | $0 | $0 |
| 2020 | $309 | $0 | $0 | $0 |
| 2019 | $406 | $0 | $0 | $0 |
| 2018 | $602 | $0 | $0 | $0 |
| 2017 | $602 | $0 | $0 | $0 |
| 2016 | $602 | $0 | $0 | $0 |
| 2015 | $705 | $0 | $0 | $0 |
| 2014 | -- | $52,600 | $4,766 | $47,834 |
| 2012 | -- | $3,680 | $861 | $2,819 |
Source: Public Records
Map
Nearby Homes