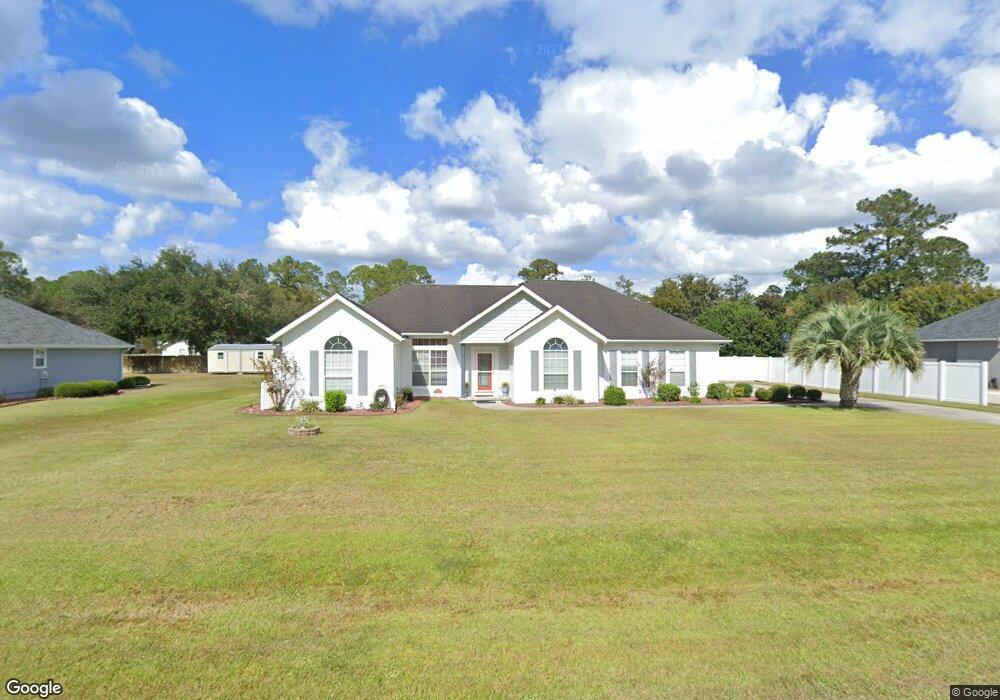
2939 Bentwood Dr Waycross, GA 31503
Estimated Value: $290,782 - $336,000
3
Beds
2
Baths
1,986
Sq Ft
$159/Sq Ft
Est. Value
About This Home
This home is located at 2939 Bentwood Dr, Waycross, GA 31503 and is currently estimated at $315,946, approximately $159 per square foot. 2939 Bentwood Dr is a home located in Ware County with nearby schools including Williams Heights Elementary School, Waycross Middle School, and Ware County High School.
Ownership History
Date
Name
Owned For
Owner Type
Purchase Details
Closed on
Nov 30, 2006
Sold by
Thornton Gary Craig
Bought by
Green Rebecca
Current Estimated Value
Home Financials for this Owner
Home Financials are based on the most recent Mortgage that was taken out on this home.
Original Mortgage
$131,200
Outstanding Balance
$78,355
Interest Rate
6.29%
Mortgage Type
New Conventional
Estimated Equity
$237,591
Purchase Details
Closed on
Jun 7, 2005
Sold by
Gourley Evan
Bought by
Thornton Gary Craig and Thornton Jeffrey Casey
Purchase Details
Closed on
Jan 27, 2000
Sold by
Thornton Gary C and Thornton Je
Bought by
Gourley Evan and Gourley Jenny
Purchase Details
Closed on
Nov 15, 1999
Sold by
Thornton Gary and Thornton Lind
Bought by
Thornton Gary C and Thornton Je
Purchase Details
Closed on
Oct 30, 1998
Sold by
Waycross Properties
Bought by
Thornton Gary and Thornton Lind
Purchase Details
Closed on
Mar 31, 1998
Sold by
Griffin Avery C
Bought by
Waycross Properties
Purchase Details
Closed on
Feb 9, 1997
Sold by
Johnson Lamar
Bought by
Griffin Avery C
Create a Home Valuation Report for This Property
The Home Valuation Report is an in-depth analysis detailing your home's value as well as a comparison with similar homes in the area
Home Values in the Area
Average Home Value in this Area
Purchase History
| Date | Buyer | Sale Price | Title Company |
|---|---|---|---|
| Green Rebecca | $164,000 | -- | |
| Thornton Gary Craig | $132,914 | -- | |
| Gourley Evan | $130,000 | -- | |
| Thornton Gary C | $16,000 | -- | |
| Thornton Gary | $16,000 | -- | |
| Waycross Properties | $24,000 | -- | |
| Griffin Avery C | $24,000 | -- |
Source: Public Records
Mortgage History
| Date | Status | Borrower | Loan Amount |
|---|---|---|---|
| Open | Green Rebecca | $131,200 |
Source: Public Records
Tax History Compared to Growth
Tax History
| Year | Tax Paid | Tax Assessment Tax Assessment Total Assessment is a certain percentage of the fair market value that is determined by local assessors to be the total taxable value of land and additions on the property. | Land | Improvement |
|---|---|---|---|---|
| 2024 | $1,159 | $114,095 | $9,360 | $104,735 |
| 2023 | $1,182 | $87,173 | $12,000 | $75,173 |
| 2022 | $1,297 | $86,672 | $12,000 | $74,672 |
| 2021 | $1,359 | $71,611 | $12,000 | $59,611 |
| 2020 | $1,373 | $69,688 | $12,000 | $57,688 |
| 2019 | $985 | $52,382 | $12,000 | $40,382 |
| 2018 | $931 | $50,459 | $12,000 | $38,459 |
| 2017 | $1,374 | $50,459 | $12,000 | $38,459 |
| 2016 | $1,374 | $64,060 | $12,000 | $52,060 |
| 2015 | $1,385 | $64,060 | $12,000 | $52,060 |
| 2014 | $1,380 | $64,060 | $12,000 | $52,060 |
| 2013 | -- | $64,060 | $12,000 | $52,060 |
Source: Public Records
Map
Nearby Homes
- 763 Kentland Dr
- 3153 Southwood Dr
- 723 St Bernard Trail
- 867 Kentland Dr
- 3070 Central Ave
- 2775 Seminole Trail
- 1049 Riverdale Dr
- 955 Lynn Dr
- 0 Brunswick Hwy Unit 1648370
- 291 Sawdust Trail
- 1132 Hilltop Rd
- 914 Barkley St
- 3817 Central Ave
- 1312 Atlantic Ave
- 807 City Blvd
- 1502 Seminole Trail
- 1204 Richmond Ave
- 7438 Central Ave
- 606 Stonewall Jackson Place
- 4155 Pinecrest Rd
- 2969 Bentwood Dr
- 2915 Bentwood Dr
- 2938 Birchwood Dr
- 2972 Birchwood Dr
- 2920 Birchwood Dr
- 2938 Bentwood Dr
- 2985 Bentwood Dr
- 2920 Bentwood Dr
- 2990 Birchwood Dr
- 3015 Bentwood Dr
- 605 Kentland Dr
- 2939 Birchwood Dr
- 615 Kentland Dr
- 3057 Orion Dr
- 585 Kentland Dr
- 2969 Birchwood Dr
- 2915 Birchwood Dr
- 3031 Orion Dr
- 3071 Orion Dr
- 647 Kentland Dr