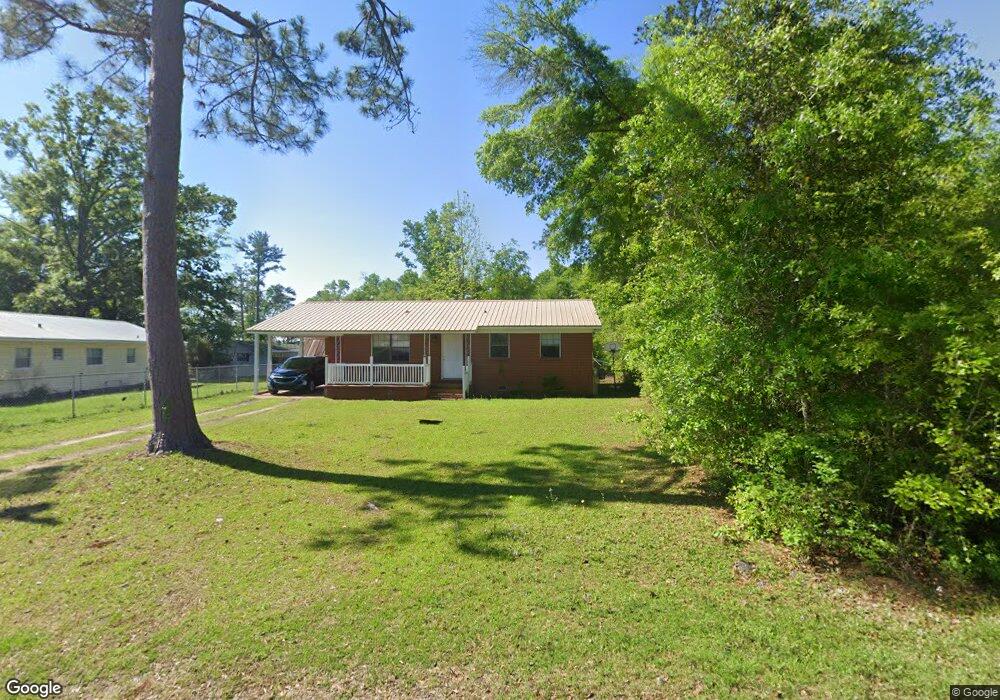
2939 Hillcrest St Marianna, FL 32448
Estimated Value: $56,000 - $106,151
2
Beds
1
Bath
999
Sq Ft
$82/Sq Ft
Est. Value
About This Home
This home is located at 2939 Hillcrest St, Marianna, FL 32448 and is currently estimated at $82,038, approximately $82 per square foot. 2939 Hillcrest St is a home located in Jackson County with nearby schools including Marianna K-8 School and Marianna High School.
Ownership History
Date
Name
Owned For
Owner Type
Purchase Details
Closed on
Jul 24, 2023
Sold by
M A S Farm Llc and Pereda Julio C
Bought by
Pereda Julio C
Current Estimated Value
Purchase Details
Closed on
Jan 22, 2021
Sold by
Norstev Enterprises Llc
Bought by
Mas Farm Llc
Purchase Details
Closed on
Jan 12, 2021
Sold by
Banks Bruce Earl and Banks Nicholas Keith
Bought by
Norstev Enterprises Llc
Purchase Details
Closed on
May 2, 2013
Sold by
United States Of America
Bought by
Banks Bruce E
Purchase Details
Closed on
Jun 26, 2012
Sold by
Staley Virginia and Myrick Calvin
Bought by
United States Of America
Purchase Details
Closed on
Jul 27, 2001
Sold by
Duelz Pierre and Duelz Vicki
Bought by
Myrick Bertha Mae
Home Financials for this Owner
Home Financials are based on the most recent Mortgage that was taken out on this home.
Original Mortgage
$44,895
Interest Rate
7.08%
Create a Home Valuation Report for This Property
The Home Valuation Report is an in-depth analysis detailing your home's value as well as a comparison with similar homes in the area
Home Values in the Area
Average Home Value in this Area
Purchase History
| Date | Buyer | Sale Price | Title Company |
|---|---|---|---|
| Pereda Julio C | $100 | None Listed On Document | |
| Mas Farm Llc | $28,000 | First International Ttl Inc | |
| Norstev Enterprises Llc | $16,000 | Attorney | |
| Banks Bruce E | $40,000 | None Available | |
| United States Of America | -- | None Available | |
| Myrick Bertha Mae | $49,900 | Chipola Abstract & Land Titl |
Source: Public Records
Mortgage History
| Date | Status | Borrower | Loan Amount |
|---|---|---|---|
| Previous Owner | Myrick Bertha Mae | $44,895 |
Source: Public Records
Tax History Compared to Growth
Tax History
| Year | Tax Paid | Tax Assessment Tax Assessment Total Assessment is a certain percentage of the fair market value that is determined by local assessors to be the total taxable value of land and additions on the property. | Land | Improvement |
|---|---|---|---|---|
| 2025 | $1,267 | $73,120 | $3,900 | $69,220 |
| 2024 | $1,255 | $74,402 | $3,900 | $70,502 |
| 2023 | $1,089 | $72,418 | $3,900 | $68,518 |
| 2022 | $911 | $59,232 | $3,900 | $55,332 |
| 2021 | $742 | $48,155 | $3,900 | $44,255 |
| 2020 | $678 | $42,009 | $3,900 | $38,109 |
| 2019 | $706 | $41,905 | $3,900 | $38,005 |
| 2018 | $709 | $42,538 | $3,900 | $38,638 |
| 2017 | $714 | $42,741 | $3,900 | $38,841 |
| 2016 | $709 | $43,105 | $3,900 | $39,205 |
| 2015 | $310 | $43,460 | $3,900 | $39,560 |
| 2014 | $307 | $43,176 | $3,900 | $39,276 |
Source: Public Records
Map
Nearby Homes
- 0 Old Cottondale Rd Unit 753879
- 4013 Lafayette St
- 2933 Wildwood Cir
- 00 Jireh Ct
- 4071 Lafayette St
- 0000 Penn Ave
- 4164 Old Cottondale Rd
- 4114 Lafayette St
- 4146 Lafayette St
- 3096 Cambleton
- 2916 Milton Ave
- 4181 Lafayette St
- OO Cedar St
- 0 Bumpnose Rd Unit 730126
- 0 Kelson Ave
- 2838 Booker St
- 3003 Carters Mill Rd
- 2925 Orange St
- 2859 Orange St
- 0 Lafayette St Unit 773800
- 2935 Hall St
- 2931 Hall St
- 2941 Hall St
- 2927 Hall St
- 2945 Hall St
- 2940 Hall St
- 2947 Hall St
- 2946 Hall St
- 2924 Hall St
- 4036 Old Cottondale Rd
- 4024 Old Cottondale Rd
- 2960 Hillcrest St
- 2950 Hall St
- 4016 Old Cottondale Rd
- 0 Old Cottondale Rd Unit 748588
- 0 Old Cottondale Rd Unit 720870
- 0 Old Cottondale Rd Unit 722489
- 2962 Hillcrest St
- 2912 Sunset Dr
- 2914 Sunset Dr