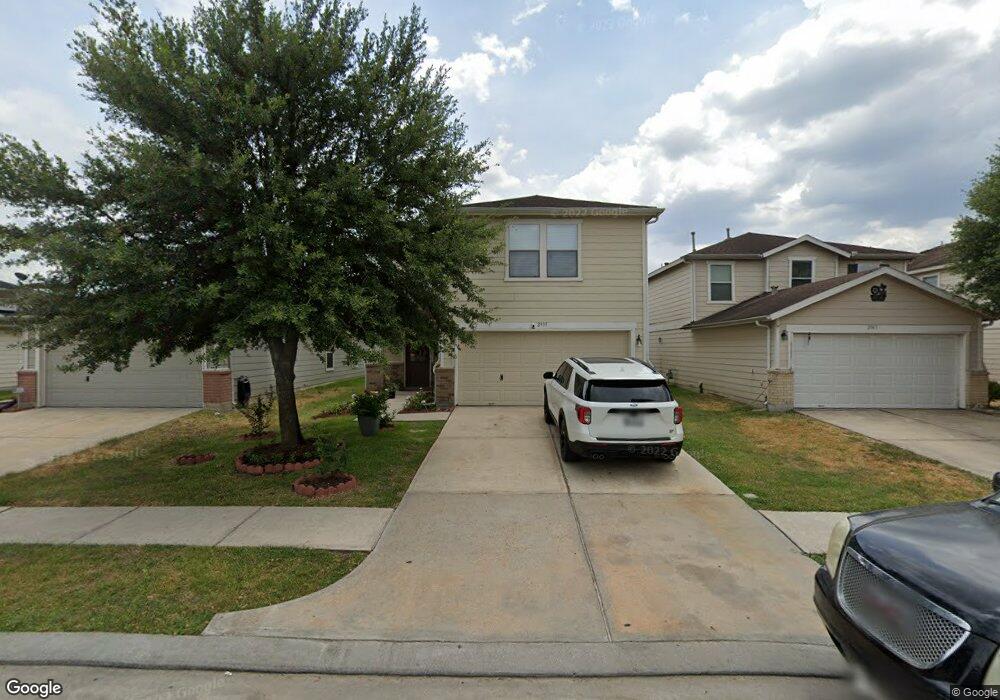
2939 Latch Ln Houston, TX 77038
North Houston NeighborhoodEstimated Value: $238,000 - $246,000
4
Beds
3
Baths
1,964
Sq Ft
$122/Sq Ft
Est. Value
About This Home
This home is located at 2939 Latch Ln, Houston, TX 77038 and is currently estimated at $240,561, approximately $122 per square foot. 2939 Latch Ln is a home located in Harris County with nearby schools including Kujawa EC/Pre-K/K School, Carter Academy, and Shotwell Middle School.
Ownership History
Date
Name
Owned For
Owner Type
Purchase Details
Closed on
Aug 22, 2022
Sold by
Juan Arrugama Jose
Bought by
Guzman Kerin Rivera
Current Estimated Value
Home Financials for this Owner
Home Financials are based on the most recent Mortgage that was taken out on this home.
Original Mortgage
$195,500
Outstanding Balance
$186,592
Interest Rate
5.3%
Mortgage Type
New Conventional
Estimated Equity
$53,969
Purchase Details
Closed on
Nov 2, 2009
Sold by
Lee Meng
Bought by
Arrugama Jose Juan
Home Financials for this Owner
Home Financials are based on the most recent Mortgage that was taken out on this home.
Original Mortgage
$94,575
Interest Rate
5.03%
Mortgage Type
New Conventional
Purchase Details
Closed on
Mar 31, 2006
Sold by
Kb Home Lone Star Lp
Bought by
Lee Meng
Home Financials for this Owner
Home Financials are based on the most recent Mortgage that was taken out on this home.
Original Mortgage
$17,160
Interest Rate
6.22%
Mortgage Type
Stand Alone Second
Create a Home Valuation Report for This Property
The Home Valuation Report is an in-depth analysis detailing your home's value as well as a comparison with similar homes in the area
Home Values in the Area
Average Home Value in this Area
Purchase History
| Date | Buyer | Sale Price | Title Company |
|---|---|---|---|
| Guzman Kerin Rivera | -- | None Listed On Document | |
| Arrugama Jose Juan | -- | Chicago Title | |
| Lee Meng | -- | First American Title |
Source: Public Records
Mortgage History
| Date | Status | Borrower | Loan Amount |
|---|---|---|---|
| Open | Guzman Kerin Rivera | $195,500 | |
| Previous Owner | Arrugama Jose Juan | $94,575 | |
| Previous Owner | Lee Meng | $17,160 | |
| Previous Owner | Lee Meng | $91,524 |
Source: Public Records
Tax History Compared to Growth
Tax History
| Year | Tax Paid | Tax Assessment Tax Assessment Total Assessment is a certain percentage of the fair market value that is determined by local assessors to be the total taxable value of land and additions on the property. | Land | Improvement |
|---|---|---|---|---|
| 2025 | $7,125 | $234,404 | $43,560 | $190,844 |
| 2024 | $7,125 | $234,404 | $43,560 | $190,844 |
| 2023 | $7,125 | $235,413 | $43,560 | $191,853 |
| 2022 | $6,158 | $207,161 | $26,400 | $180,761 |
| 2021 | $5,816 | $174,821 | $26,400 | $148,421 |
| 2020 | $5,465 | $156,539 | $26,400 | $130,139 |
| 2019 | $5,117 | $145,300 | $19,800 | $125,500 |
| 2018 | $1,457 | $137,618 | $19,800 | $117,818 |
| 2017 | $4,100 | $137,618 | $19,800 | $117,818 |
| 2016 | $3,727 | $120,615 | $19,800 | $100,815 |
| 2015 | $2,741 | $120,615 | $19,800 | $100,815 |
| 2014 | $2,741 | $92,902 | $19,800 | $73,102 |
Source: Public Records
Map
Nearby Homes
- 11707 Madison Oak St
- 2907 Valiant Scene Ct
- 2934 Valiant Scene Ct
- 11623 Quinn Ridge Way
- 12006 Mallard Stream Ct
- 12015 Audubon Hill Ct
- 2746 Piney Lake Ct
- 12007 Bach Orchard Trail
- 12026 Madison Oak St
- 2743 Oriole Wood Ct
- 11727 State Highway 249
- 12042 Mallard Stream Ct
- 11638 Township Dale Ct
- 11726 Wren Crossing Dr
- 2934 Washington Dr
- 2930 Washington Dr
- 10809 W Montgomery Rd
- 11618 Wren Crossing Dr
- 9218 Washington Dr
- 9217 Washington Dr
- 2943 Latch Ln
- 2935 Latch Ln
- 2931 Latch Ln
- 2947 Latch Ln
- 2930 Redwing Grove Way
- 2927 Latch Ln
- 2926 Redwing Grove Way
- 2951 Latch Ln
- 11735 Wainscot Ct
- 2922 Redwing Grove Way
- 2923 Latch Ln
- 2938 Latch Ln
- 2934 Latch Ln
- 2942 Latch Ln
- 2930 Latch Ln
- 2946 Latch Ln
- 2918 Redwing Grove Way
- 2919 Latch Ln
- 2926 Latch Ln
- 2950 Latch Ln