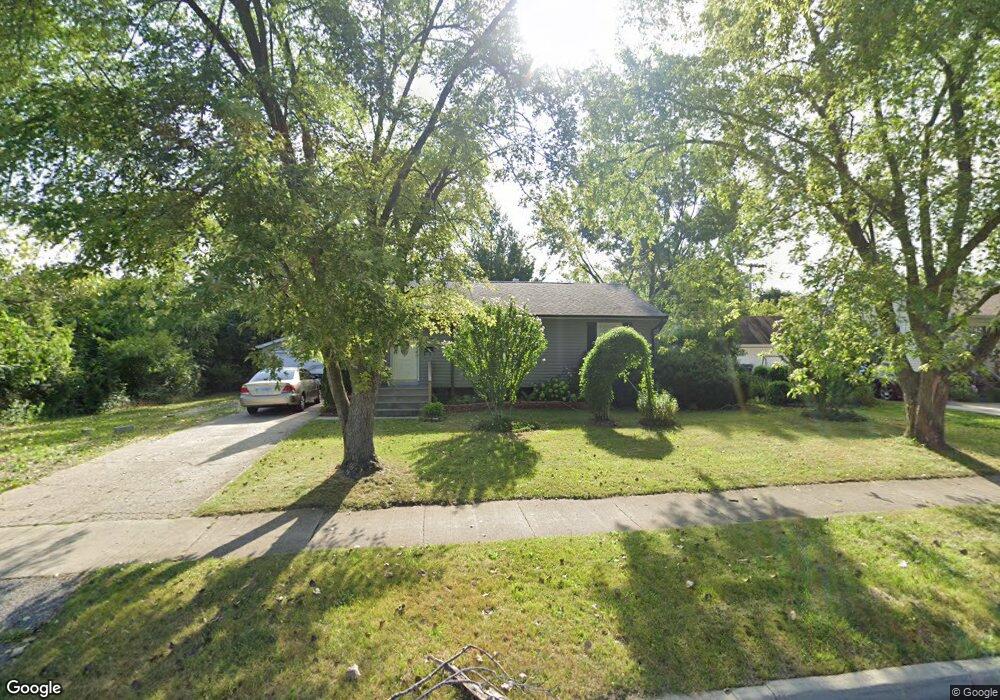
2939 N Butrick St Waukegan, IL 60087
Lake County Gardens NeighborhoodEstimated Value: $195,000 - $244,000
3
Beds
2
Baths
864
Sq Ft
$253/Sq Ft
Est. Value
About This Home
This home is located at 2939 N Butrick St, Waukegan, IL 60087 and is currently estimated at $218,427, approximately $252 per square foot. 2939 N Butrick St is a home located in Lake County with nearby schools including Little Fort Elementary School, Jack Benny Middle School, and Waukegan High School.
Ownership History
Date
Name
Owned For
Owner Type
Purchase Details
Closed on
Jun 9, 2023
Sold by
Gonzalez Carlos and Gonzalez Gabriela
Bought by
Gonzalez Wendy
Current Estimated Value
Home Financials for this Owner
Home Financials are based on the most recent Mortgage that was taken out on this home.
Original Mortgage
$114,800
Outstanding Balance
$111,927
Interest Rate
6.75%
Mortgage Type
New Conventional
Estimated Equity
$106,500
Purchase Details
Closed on
Jul 17, 2000
Sold by
Perez Jose A and Perez Isabel C
Bought by
Gonzalez Carlos and Gonzalez Gabriela
Home Financials for this Owner
Home Financials are based on the most recent Mortgage that was taken out on this home.
Original Mortgage
$111,810
Interest Rate
8.24%
Mortgage Type
FHA
Purchase Details
Closed on
Jun 19, 1995
Sold by
Lundy Charles and Lundy Mario Jean
Bought by
Perez Jose A and Perez Isabel C
Home Financials for this Owner
Home Financials are based on the most recent Mortgage that was taken out on this home.
Original Mortgage
$90,389
Interest Rate
7.9%
Mortgage Type
FHA
Purchase Details
Closed on
Nov 4, 1993
Sold by
Bank Of Waukegan
Bought by
Lundy Charles and Lundy Mario Jean
Create a Home Valuation Report for This Property
The Home Valuation Report is an in-depth analysis detailing your home's value as well as a comparison with similar homes in the area
Home Values in the Area
Average Home Value in this Area
Purchase History
| Date | Buyer | Sale Price | Title Company |
|---|---|---|---|
| Gonzalez Wendy | $143,500 | Fidelity National Title | |
| Gonzalez Carlos | $112,000 | Ticor Title | |
| Perez Jose A | $91,000 | -- | |
| Lundy Charles | -- | -- |
Source: Public Records
Mortgage History
| Date | Status | Borrower | Loan Amount |
|---|---|---|---|
| Open | Gonzalez Wendy | $114,800 | |
| Previous Owner | Gonzalez Carlos | $111,810 | |
| Previous Owner | Perez Jose A | $90,389 |
Source: Public Records
Tax History Compared to Growth
Tax History
| Year | Tax Paid | Tax Assessment Tax Assessment Total Assessment is a certain percentage of the fair market value that is determined by local assessors to be the total taxable value of land and additions on the property. | Land | Improvement |
|---|---|---|---|---|
| 2024 | $4,896 | $66,328 | $11,910 | $54,418 |
| 2023 | $4,307 | $59,921 | $10,759 | $49,162 |
| 2022 | $4,307 | $50,059 | $10,251 | $39,808 |
| 2021 | $3,934 | $43,738 | $8,876 | $34,862 |
| 2020 | $3,939 | $40,747 | $8,269 | $32,478 |
| 2019 | $3,911 | $37,338 | $7,577 | $29,761 |
| 2018 | $3,225 | $31,326 | $9,652 | $21,674 |
| 2017 | $3,089 | $27,714 | $8,539 | $19,175 |
| 2016 | $2,794 | $24,082 | $7,420 | $16,662 |
| 2015 | $2,627 | $21,554 | $6,641 | $14,913 |
| 2014 | $2,602 | $20,918 | $6,303 | $14,615 |
| 2012 | $3,694 | $23,948 | $6,829 | $17,119 |
Source: Public Records
Map
Nearby Homes
- 1636 Rice St
- 1612 Whitney St
- 37905 N Loyola Ave
- 2613 N Lewis Ave
- 37966 N Cornell Rd
- 3211 Rugby Ct
- 38127 N Shore Ave
- 38362 N Manor Ave
- 3411 N Lewis Ave
- 2350 N Lewis Ave
- 301 W Eagle Ct
- 10241 W Bairstow Ave
- 2232 Walnut St
- 0 Traditions Dr
- 3101 Country Club Ln
- 1730 W Beach Rd
- 2708 Dana Ave
- 37231 N Ganster Rd
- 2705 Dana Ave
- 38697 N Cedar Ave
- 2935 N Butrick St
- 2933 N Pine St Unit 4
- 2929 N Pine St
- 2934 N Butrick St
- 2930 N Butrick St
- 2925 N Pine St
- 400 Rice St
- 2930 N Pine St
- 2921 N Pine St
- 2920 N Pine St
- 2917 N Butrick St
- 2917 N Pine St
- 2916 N Pine St
- 1313 Lizabeth Ln
- 1311 Lizabeth Ln
- 2913 N Butrick St
- 1309 Lizabeth Ln
- 1407 Lizabeth Ln
- 2913 N Pine St
- 1307 Lizabeth Ln