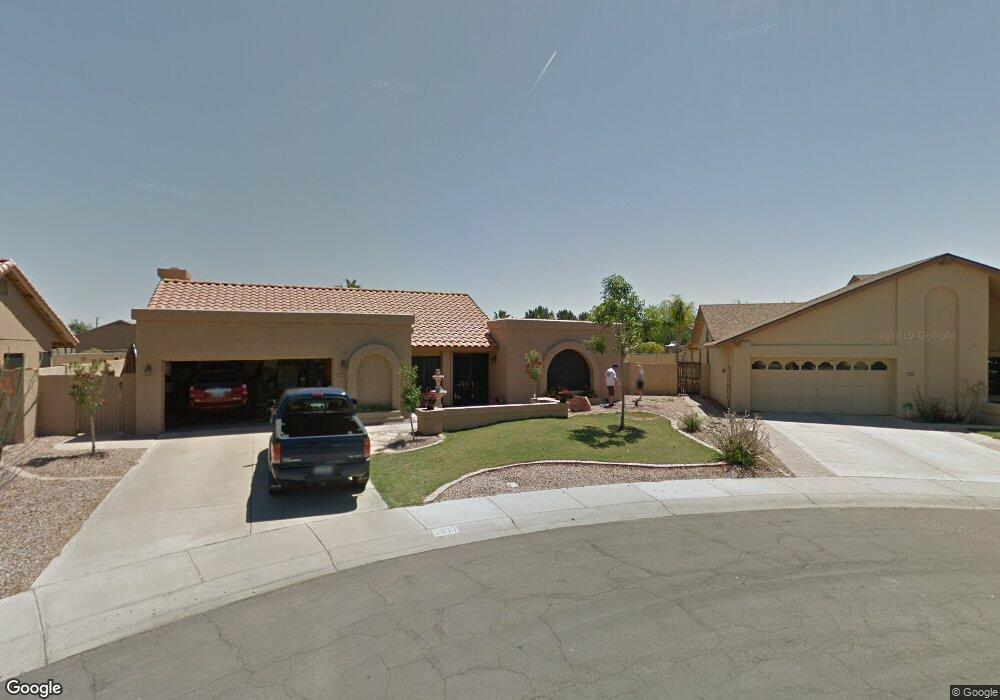
2939 N Carriage Ln Chandler, AZ 85224
Central Ridge NeighborhoodEstimated Value: $518,260 - $650,000
--
Bed
3
Baths
2,204
Sq Ft
$269/Sq Ft
Est. Value
About This Home
This home is located at 2939 N Carriage Ln, Chandler, AZ 85224 and is currently estimated at $592,565, approximately $268 per square foot. 2939 N Carriage Ln is a home located in Maricopa County with nearby schools including Pomeroy Elementary School, Franklin at Brimhall Elementary School, and Franklin Accelerated Academy Jordan Campus.
Ownership History
Date
Name
Owned For
Owner Type
Purchase Details
Closed on
Aug 6, 2025
Sold by
Greguska William Francis and Greguska Patricia Kath
Bought by
William Francis Greguska & Patricia Kathleen
Current Estimated Value
Purchase Details
Closed on
Nov 22, 1999
Sold by
Woodruff William A and Woodruff Karen A
Bought by
Greguska William F and Greguska Patricia K
Home Financials for this Owner
Home Financials are based on the most recent Mortgage that was taken out on this home.
Original Mortgage
$164,250
Interest Rate
7.84%
Mortgage Type
New Conventional
Purchase Details
Closed on
Jun 24, 1994
Sold by
Justesen Brad D and Justesen Janet C
Bought by
Woodruff William A and Woodruff Karen A
Home Financials for this Owner
Home Financials are based on the most recent Mortgage that was taken out on this home.
Original Mortgage
$130,150
Interest Rate
8.38%
Mortgage Type
New Conventional
Create a Home Valuation Report for This Property
The Home Valuation Report is an in-depth analysis detailing your home's value as well as a comparison with similar homes in the area
Home Values in the Area
Average Home Value in this Area
Purchase History
| Date | Buyer | Sale Price | Title Company |
|---|---|---|---|
| William Francis Greguska & Patricia Kathleen | -- | None Listed On Document | |
| Greguska William F | $182,500 | Security Title Agency | |
| Woodruff William A | $137,500 | United Title Agency |
Source: Public Records
Mortgage History
| Date | Status | Borrower | Loan Amount |
|---|---|---|---|
| Previous Owner | Greguska William F | $164,250 | |
| Previous Owner | Woodruff William A | $130,150 |
Source: Public Records
Tax History Compared to Growth
Tax History
| Year | Tax Paid | Tax Assessment Tax Assessment Total Assessment is a certain percentage of the fair market value that is determined by local assessors to be the total taxable value of land and additions on the property. | Land | Improvement |
|---|---|---|---|---|
| 2025 | $2,218 | $26,000 | -- | -- |
| 2024 | $2,238 | $24,762 | -- | -- |
| 2023 | $2,238 | $44,660 | $8,930 | $35,730 |
| 2022 | $2,177 | $33,720 | $6,740 | $26,980 |
| 2021 | $2,189 | $31,630 | $6,320 | $25,310 |
| 2020 | $2,165 | $29,720 | $5,940 | $23,780 |
| 2019 | $1,993 | $27,960 | $5,590 | $22,370 |
| 2018 | $1,936 | $26,170 | $5,230 | $20,940 |
| 2017 | $1,862 | $25,100 | $5,020 | $20,080 |
| 2016 | $1,821 | $25,270 | $5,050 | $20,220 |
| 2015 | $1,713 | $22,780 | $4,550 | $18,230 |
Source: Public Records
Map
Nearby Homes
- 2674 N El Dorado Dr
- 2337 W Cheyenne Dr
- 2029 W Shawnee Dr
- 2615 N Yucca St
- 2014 W Summit Place
- 1821 W Mission Dr
- 1805 W Cheyenne Dr
- 2727 N Price Rd Unit 50
- 2727 N Price Rd Unit 57
- 2727 N Price Rd Unit 28
- 1807 W Mission Dr
- 1800 W Rosewood Ct
- 2103 W Palomino Dr
- 2210 N Los Altos Dr
- 2334 W Peralta Ave
- 2811 W Rosewood Dr
- 2453 W Pecos Ave
- 1511 W Mesquite St
- 2129 N Villas Ln
- 2030 W Portobello Ave
- 2943 N Carriage Ln
- 2309 W Gregg Dr
- 2152 W Comstock Dr Unit 75
- 2947 N Carriage Ln
- 2313 W Gregg Dr
- 2308 W Comstock Dr
- 2312 W Gregg Dr
- 2304 W Comstock Dr
- 2312 W Comstock Dr
- 2316 W Comstock Dr
- 2320 W Comstock Dr
- 2317 W Gregg Dr
- 2311 W Alamo Dr
- 2324 W Comstock Dr
- 2316 W Gregg Dr
- 2951 N Carriage Ln
- 2328 W Comstock Dr
- 2315 W Alamo Dr
- 2142 W Comstock Dr
- 2332 W Comstock Dr