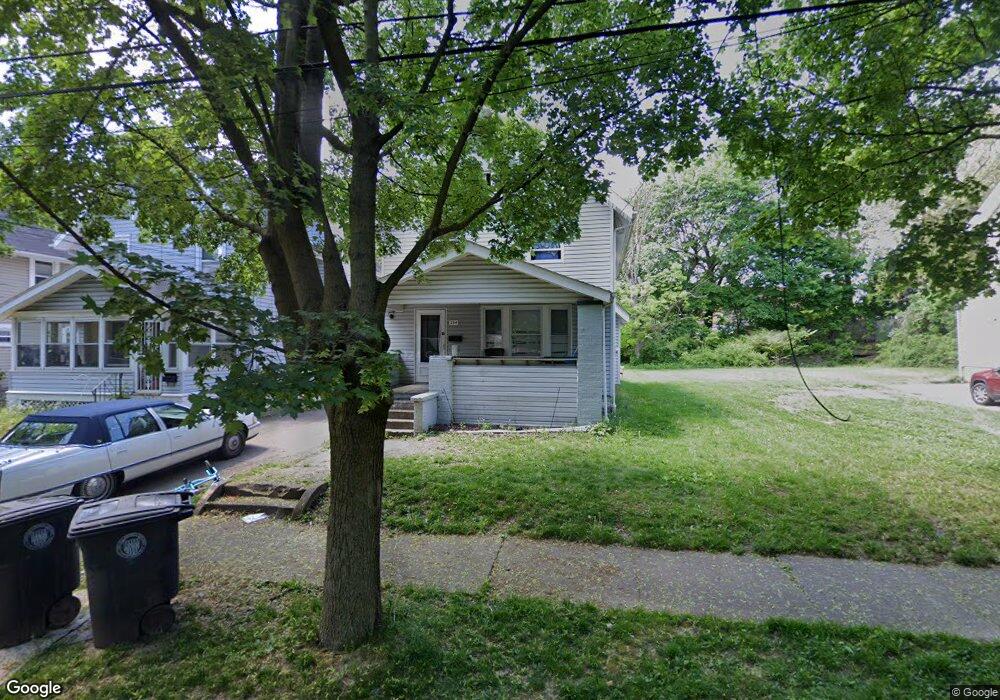
294 Black St Akron, OH 44306
Middlebury NeighborhoodEstimated Value: $86,710 - $106,000
5
Beds
2
Baths
2,006
Sq Ft
$48/Sq Ft
Est. Value
About This Home
This home is located at 294 Black St, Akron, OH 44306 and is currently estimated at $96,928, approximately $48 per square foot. 294 Black St is a home located in Summit County with nearby schools including Case Preparatory Academy, Middlebury Academy, and Akron Preparatory school.
Ownership History
Date
Name
Owned For
Owner Type
Purchase Details
Closed on
Jan 22, 2021
Sold by
Well Community Development Corporation
Bought by
Middlebury Housing Llc
Current Estimated Value
Purchase Details
Closed on
Jan 18, 2018
Sold by
Pulghee James S and Pulghee Kalle
Bought by
The Well Community Development Corp
Purchase Details
Closed on
Jun 4, 2010
Sold by
Deutsche Bank National Trust Company
Bought by
Pugliese James S
Purchase Details
Closed on
Apr 26, 2010
Sold by
Oden Stephen
Bought by
Deutsche Bank National Trust Company
Purchase Details
Closed on
Oct 30, 2006
Sold by
Crowe Carla J and Crowe Timothy J
Bought by
Oden Stephen
Home Financials for this Owner
Home Financials are based on the most recent Mortgage that was taken out on this home.
Original Mortgage
$67,500
Interest Rate
9.17%
Mortgage Type
Purchase Money Mortgage
Purchase Details
Closed on
Oct 4, 2002
Sold by
Crowe Carla J and Crowe Timothy J
Bought by
Crowe Timothy J and Crowe Carla J
Home Financials for this Owner
Home Financials are based on the most recent Mortgage that was taken out on this home.
Original Mortgage
$41,700
Interest Rate
6.18%
Create a Home Valuation Report for This Property
The Home Valuation Report is an in-depth analysis detailing your home's value as well as a comparison with similar homes in the area
Home Values in the Area
Average Home Value in this Area
Purchase History
| Date | Buyer | Sale Price | Title Company |
|---|---|---|---|
| Middlebury Housing Llc | -- | Accommodation | |
| The Well Community Development Corp | $45,500 | None Available | |
| Pugliese James S | $12,250 | Attorney | |
| Deutsche Bank National Trust Company | $48,000 | Attorney | |
| Oden Stephen | $75,000 | Southeast Equity Title | |
| Crowe Timothy J | -- | First Class Title Agency Inc |
Source: Public Records
Mortgage History
| Date | Status | Borrower | Loan Amount |
|---|---|---|---|
| Previous Owner | Oden Stephen | $67,500 | |
| Previous Owner | Crowe Timothy J | $41,700 |
Source: Public Records
Tax History
| Year | Tax Paid | Tax Assessment Tax Assessment Total Assessment is a certain percentage of the fair market value that is determined by local assessors to be the total taxable value of land and additions on the property. | Land | Improvement |
|---|---|---|---|---|
| 2024 | $1,143 | $20,447 | $3,941 | $16,506 |
| 2023 | $1,143 | $20,447 | $3,941 | $16,506 |
| 2022 | $1,075 | $15,058 | $2,818 | $12,240 |
| 2021 | $1,049 | $15,058 | $2,818 | $12,240 |
| 2020 | $1,034 | $15,060 | $2,820 | $12,240 |
| 2019 | $1,158 | $15,450 | $4,260 | $11,190 |
| 2018 | $1,174 | $15,450 | $4,260 | $11,190 |
| 2017 | $1,087 | $15,450 | $4,260 | $11,190 |
| 2016 | $1,087 | $14,000 | $4,260 | $9,740 |
| 2015 | $1,087 | $14,000 | $4,260 | $9,740 |
| 2014 | $1,078 | $14,000 | $4,260 | $9,740 |
| 2013 | $1,007 | $13,300 | $4,260 | $9,040 |
Source: Public Records
Map
Nearby Homes
- 231 Windsor St
- 864 Forrest Dr
- 434 Matthews St
- 427 Mcgowan St
- 417 Margaret St
- 0 S Arlington St Unit 5134164
- 70 S Adams St
- 604 E Buchtel Ave
- 31 Mcnaughton St
- 508 Crouse St
- 840 E Buchtel Ave
- 117 Kent Ct
- 55 Eber Ave
- 124 Roswell St
- 543 E Buchtel Ave
- 117 Myers Ave
- 498 Gage St
- 906 E Buchtel Ave
- 157 Henry St
- 528 Gridley St
Your Personal Tour Guide
Ask me questions while you tour the home.