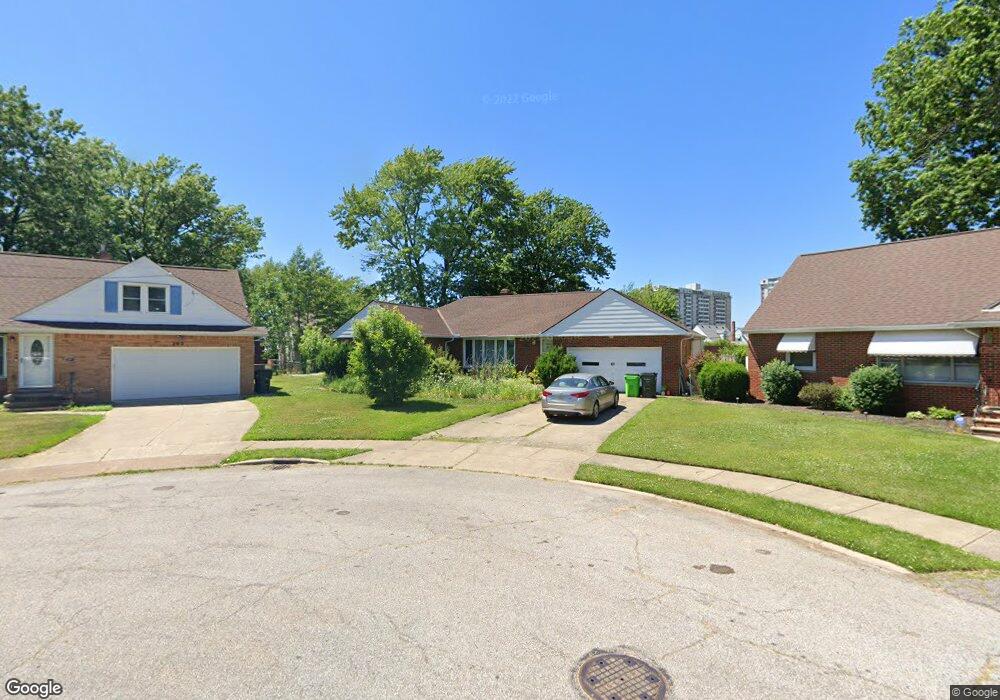
294 E 243rd St Euclid, OH 44123
Estimated Value: $160,825 - $174,000
3
Beds
2
Baths
1,329
Sq Ft
$126/Sq Ft
Est. Value
About This Home
This home is located at 294 E 243rd St, Euclid, OH 44123 and is currently estimated at $167,206, approximately $125 per square foot. 294 E 243rd St is a home located in Cuyahoga County with nearby schools including Shoreview Elementary School, Euclid High School, and Our Lady Of The Lake School.
Ownership History
Date
Name
Owned For
Owner Type
Purchase Details
Closed on
Aug 4, 2022
Sold by
Zhang Bao Q
Bought by
Zhang Elizabeth Wei Hua
Current Estimated Value
Purchase Details
Closed on
Jan 17, 2018
Sold by
Zhang Bao Q
Bought by
Zhang Bao Q and Zhang Elizabeth Wei Hua
Purchase Details
Closed on
Aug 12, 1998
Sold by
Zhang Yue and Zhang David Yue
Bought by
Zhang Jiang S and Zhang Bao Q
Purchase Details
Closed on
Jul 30, 1996
Sold by
Piotrowski Kathleen I
Bought by
Zhang Jiang S and Zhang Bao Q
Purchase Details
Closed on
Jan 16, 1990
Sold by
Piotrowski Kathleen Isabel
Bought by
Piotrowski Kathleen Isabel
Purchase Details
Closed on
Dec 28, 1989
Sold by
Purtill Leo A
Bought by
Piotrowski Kathleen Isabel
Purchase Details
Closed on
Sep 12, 1986
Sold by
Purtill Leo A and Purtill Isabel
Bought by
Purtill Leo A
Purchase Details
Closed on
Jan 1, 1975
Bought by
Purtill Leo A and Purtill Isabel
Create a Home Valuation Report for This Property
The Home Valuation Report is an in-depth analysis detailing your home's value as well as a comparison with similar homes in the area
Home Values in the Area
Average Home Value in this Area
Purchase History
| Date | Buyer | Sale Price | Title Company |
|---|---|---|---|
| Zhang Elizabeth Wei Hua | -- | Ace Title | |
| Zhang Bao Q | -- | Ace Title | |
| Zhang Bao Q | -- | Act Title | |
| Zhang Jiang S | -- | -- | |
| Zhang Jiang S | $92,000 | -- | |
| Piotrowski Kathleen Isabel | $38,800 | -- | |
| Piotrowski Kathleen Isabel | -- | -- | |
| Purtill Leo A | -- | -- | |
| Purtill Leo A | -- | -- |
Source: Public Records
Tax History
| Year | Tax Paid | Tax Assessment Tax Assessment Total Assessment is a certain percentage of the fair market value that is determined by local assessors to be the total taxable value of land and additions on the property. | Land | Improvement |
|---|---|---|---|---|
| 2024 | $3,445 | $50,260 | $10,045 | $40,215 |
| 2023 | $2,790 | $32,200 | $7,280 | $24,920 |
| 2022 | $2,035 | $32,200 | $7,280 | $24,920 |
| 2021 | $2,263 | $32,200 | $7,280 | $24,920 |
| 2020 | $2,233 | $29,820 | $6,760 | $23,070 |
| 2019 | $2,837 | $85,200 | $19,300 | $65,900 |
| 2018 | $2,012 | $29,820 | $6,760 | $23,070 |
| 2017 | $2,165 | $27,620 | $5,460 | $22,160 |
| 2016 | $2,170 | $27,620 | $5,460 | $22,160 |
| 2015 | $1,978 | $27,620 | $5,460 | $22,160 |
| 2014 | $1,978 | $27,620 | $5,460 | $22,160 |
Source: Public Records
Map
Nearby Homes
- 325 E 244th St
- 244 E 238th St
- 368 E 248th St
- 110 E 238th St
- 24891 Zeman Ave
- 303 E 235th St
- 328 E 238th St
- 323 E 235th St
- 334 E 238th St
- 71 Lake Edge Dr
- 464 E 250th St
- 25151 Zeman Ave
- 324 E 235th St
- 364 Walworth Ave
- 515 E 250th St
- 25401 Farringdon Ave
- 110 E 252nd St
- 23298 Williams Ave
- 25731 Zeman Ave
- 25671 Farringdon Ave
- 298 E 243rd St
- 24351 Beachland Dr
- 235 E 242nd St
- 233 E 242nd St
- 237 E 242nd St
- 231 E 242nd St
- 24361 Beachland Dr
- 304 E 243rd St
- 239 E 242nd St
- 24354 Beachland Dr
- 229 E 242nd St
- 241 E 242nd St
- 24371 Beachland Dr
- 24371 Beachland 3 4ab Dr
- 24364 Beachland Dr
- 227 E 242nd St
- 250 E 242nd St
- 252 E 242nd St
- 244 E 242nd St
- 315 E 243rd St
Your Personal Tour Guide
Ask me questions while you tour the home.