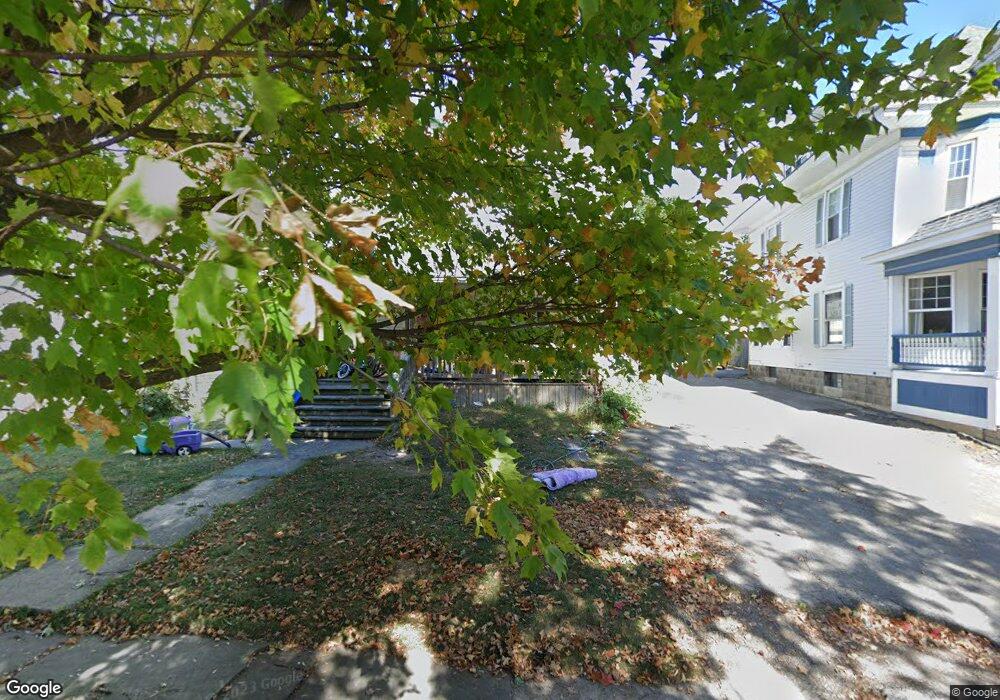
294 Franklin St Marion, OH 43302
Estimated Value: $172,000 - $202,000
4
Beds
2
Baths
1,843
Sq Ft
$99/Sq Ft
Est. Value
About This Home
This home is located at 294 Franklin St, Marion, OH 43302 and is currently estimated at $182,667, approximately $99 per square foot. 294 Franklin St is a home located in Marion County with nearby schools including Benjamin Harrison Elementary School, Ulysses S. Grant Middle School, and Harding High School.
Ownership History
Date
Name
Owned For
Owner Type
Purchase Details
Closed on
Aug 19, 2016
Sold by
Hensei Kevin A
Bought by
Field Preston W
Current Estimated Value
Home Financials for this Owner
Home Financials are based on the most recent Mortgage that was taken out on this home.
Original Mortgage
$575,500
Outstanding Balance
$458,439
Interest Rate
3.43%
Mortgage Type
Purchase Money Mortgage
Estimated Equity
-$275,772
Purchase Details
Closed on
Aug 16, 2016
Sold by
Hensel Kevin A
Bought by
Field Preston W
Home Financials for this Owner
Home Financials are based on the most recent Mortgage that was taken out on this home.
Original Mortgage
$575,500
Outstanding Balance
$458,439
Interest Rate
3.43%
Mortgage Type
Purchase Money Mortgage
Estimated Equity
-$275,772
Purchase Details
Closed on
Jan 20, 2016
Sold by
Commercial Savings Bank
Bought by
Hensel Kevin A
Purchase Details
Closed on
Mar 30, 2015
Sold by
Kellogg Donavon W
Bought by
The Commercial Savings Bank
Create a Home Valuation Report for This Property
The Home Valuation Report is an in-depth analysis detailing your home's value as well as a comparison with similar homes in the area
Home Values in the Area
Average Home Value in this Area
Purchase History
| Date | Buyer | Sale Price | Title Company |
|---|---|---|---|
| Field Preston W | $435,000 | Attorney | |
| Field Preston W | $435,000 | None Available | |
| Hensel Kevin A | $20,000 | Attorney | |
| The Commercial Savings Bank | $73,334 | Attorney |
Source: Public Records
Mortgage History
| Date | Status | Borrower | Loan Amount |
|---|---|---|---|
| Open | Field Preston W | $575,500 | |
| Closed | Field Preston W | $575,500 |
Source: Public Records
Tax History Compared to Growth
Tax History
| Year | Tax Paid | Tax Assessment Tax Assessment Total Assessment is a certain percentage of the fair market value that is determined by local assessors to be the total taxable value of land and additions on the property. | Land | Improvement |
|---|---|---|---|---|
| 2024 | $1,819 | $40,390 | $5,410 | $34,980 |
| 2023 | $1,819 | $40,390 | $5,410 | $34,980 |
| 2022 | $2,018 | $40,390 | $5,410 | $34,980 |
| 2021 | $1,973 | $32,510 | $4,710 | $27,800 |
| 2020 | $1,289 | $32,510 | $4,710 | $27,800 |
| 2019 | $1,812 | $32,510 | $4,710 | $27,800 |
| 2018 | $1,906 | $34,510 | $4,690 | $29,820 |
| 2017 | $1,816 | $34,510 | $4,690 | $29,820 |
| 2016 | $1,378 | $34,510 | $4,690 | $29,820 |
| 2015 | $1,396 | $34,210 | $4,460 | $29,750 |
| 2014 | $1,397 | $34,210 | $4,460 | $29,750 |
| 2013 | $1,011 | $34,210 | $4,460 | $29,750 |
| 2012 | $1,003 | $33,810 | $5,180 | $28,630 |
Source: Public Records
Map
Nearby Homes
- 301 S Vine St
- 239 Gurley Ave
- 338 Powhattan St
- 686 Mount Vernon Ave Unit AV
- 556 S Vine St
- 193 E Walnut St
- 249 S Grand Ave
- 159 Jefferson St
- 341 Girard Ave
- 127 E Walnut St
- 648 Fairhaven Ave
- 482 King Ave
- 699 Wilson Ave
- 265 S Seffner Ave
- 505 E Mark St
- 224 Jefferson St
- 325 Holmes Place
- 556 Hane Ave
- 514 King Ave
- 375 N Main St
- 290 Franklin St
- 290 Franklin St
- 302 Franklin St
- 286 Franklin St
- 308 Franklin St
- 250 Ellis Place
- 247 Ellis Place
- 316 Franklin St
- 260 S Vine St
- 266 S Vine St
- 252 S Vine St
- 243 Ellis Place
- 243 Arleigh Dr
- 320 Franklin St
- 248 S Vine St
- 295 Franklin St
- 285 Franklin St
- 301 Franklin St
- 236 Ellis Place
- 307 Franklin St