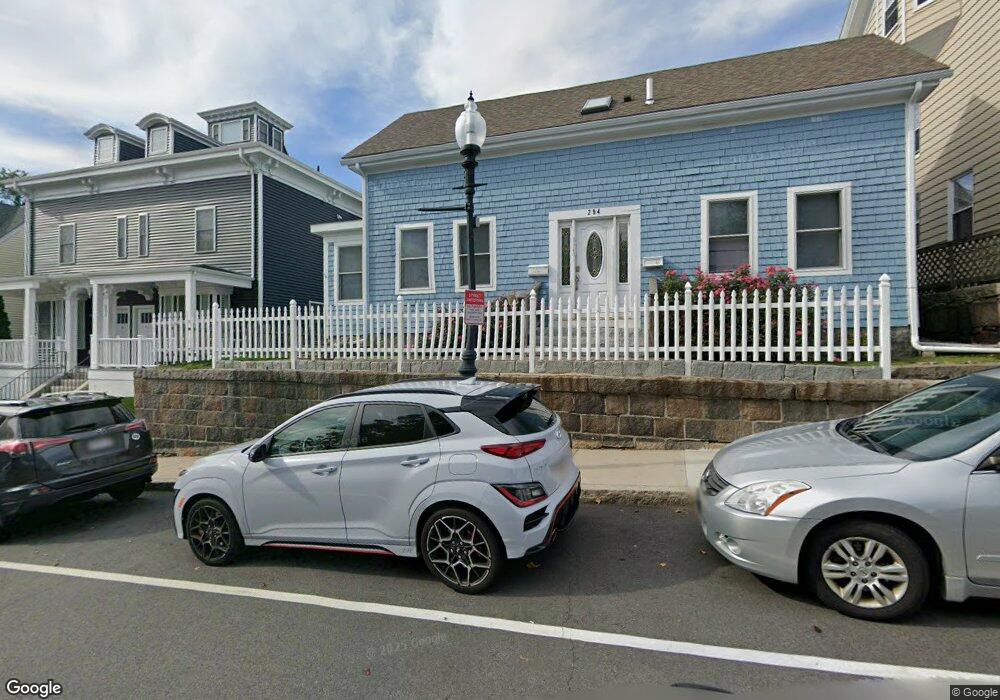
294 Main St Unit 2 Gloucester, MA 01930
Central Gloucester NeighborhoodEstimated Value: $500,000 - $640,000
1
Bed
1
Bath
800
Sq Ft
$733/Sq Ft
Est. Value
About This Home
This home is located at 294 Main St Unit 2, Gloucester, MA 01930 and is currently estimated at $586,475, approximately $733 per square foot. 294 Main St Unit 2 is a home located in Essex County with nearby schools including East Veterans Memorial Elementary, Ralph B O'maley Middle School, and Gloucester High School.
Ownership History
Date
Name
Owned For
Owner Type
Purchase Details
Closed on
Nov 23, 2020
Sold by
Whitten Ft
Bought by
Samana T
Current Estimated Value
Home Financials for this Owner
Home Financials are based on the most recent Mortgage that was taken out on this home.
Original Mortgage
$388,450
Outstanding Balance
$344,876
Interest Rate
2.8%
Mortgage Type
New Conventional
Estimated Equity
$241,599
Purchase Details
Closed on
Oct 17, 2019
Sold by
Crs Rt
Bought by
Whitten Ft
Purchase Details
Closed on
Mar 26, 2012
Sold by
Whitten Michael F
Bought by
Crs Rt
Purchase Details
Closed on
Mar 20, 2012
Sold by
Fnma
Bought by
Whitten Joseph M
Purchase Details
Closed on
Mar 14, 2012
Sold by
Dennis Robert L
Bought by
Federal National Mortgage Association
Purchase Details
Closed on
Dec 14, 2000
Sold by
Lovett Gary C
Bought by
Household Finance Co
Create a Home Valuation Report for This Property
The Home Valuation Report is an in-depth analysis detailing your home's value as well as a comparison with similar homes in the area
Home Values in the Area
Average Home Value in this Area
Purchase History
| Date | Buyer | Sale Price | Title Company |
|---|---|---|---|
| Samana T | $457,000 | None Available | |
| Whitten Ft | -- | -- | |
| Crs Rt | -- | -- | |
| Whitten Joseph M | $130,000 | -- | |
| Federal National Mortgage Association | $292,293 | -- | |
| Household Finance Co | $30,000 | -- |
Source: Public Records
Mortgage History
| Date | Status | Borrower | Loan Amount |
|---|---|---|---|
| Open | Samana T | $388,450 | |
| Previous Owner | Household Finance Co | $240,000 | |
| Previous Owner | Household Finance Co | $55,000 |
Source: Public Records
Tax History
| Year | Tax Paid | Tax Assessment Tax Assessment Total Assessment is a certain percentage of the fair market value that is determined by local assessors to be the total taxable value of land and additions on the property. | Land | Improvement |
|---|---|---|---|---|
| 2025 | $4,637 | $477,100 | $122,800 | $354,300 |
| 2024 | $4,555 | $468,100 | $117,000 | $351,100 |
| 2023 | $4,703 | $444,100 | $104,400 | $339,700 |
| 2022 | $4,422 | $377,000 | $90,800 | $286,200 |
| 2021 | $4,098 | $329,400 | $82,600 | $246,800 |
| 2020 | $3,888 | $315,300 | $82,600 | $232,700 |
| 2019 | $3,620 | $285,300 | $82,600 | $202,700 |
| 2018 | $3,384 | $261,700 | $82,600 | $179,100 |
| 2017 | $3,177 | $240,900 | $74,400 | $166,500 |
| 2016 | $3,087 | $226,800 | $74,300 | $152,500 |
| 2015 | $3,030 | $222,000 | $74,300 | $147,700 |
Source: Public Records
Map
Nearby Homes
- 139A Prospect St
- 50 Warner St
- 19 Trask St Unit 2
- 191 Main St Unit 3
- 191 Main St Unit 2A
- 113 Pleasant St
- 36 Eastern Ave
- 33 Maplewood Ave Unit 310
- 40 Sargent St
- 3 Mondello Square
- 12 Arthur St
- 9 Cleveland Place
- 35 Middle St Unit 4
- 33 Middle St
- 197 E Main St Unit 1
- 60 Rocky Neck Ave Unit 202
- 73 Rocky Neck Ave Unit 2
- 5 Wise Place
- 120 Washington St
- 98 Maplewood Ave
- 294 Main St
- 292 Main St
- 296 Main St
- 11 Spring St
- 11 Spring St Unit 1
- 13 Spring St
- 288 Main St
- 15 Spring St
- 304 Main St
- 12 Spring St
- 4 Spring St
- 10 Spring St
- 16 Spring St Unit R
- 16 Spring St
- 2 Spring Street- Summer Rental Unit A
- 2 Spring Street: Summer Vacation Unit A
- 2 Spring Street: Summer Unit A
- 2 Spring Street: Winter Unit 1
- 2 Spring St
- 2 Spring St Unit 2a Spring St Glouces
Your Personal Tour Guide
Ask me questions while you tour the home.