Estimated Value: $283,392 - $353,000
Studio
--
Bath
1,286
Sq Ft
$251/Sq Ft
Est. Value
About This Home
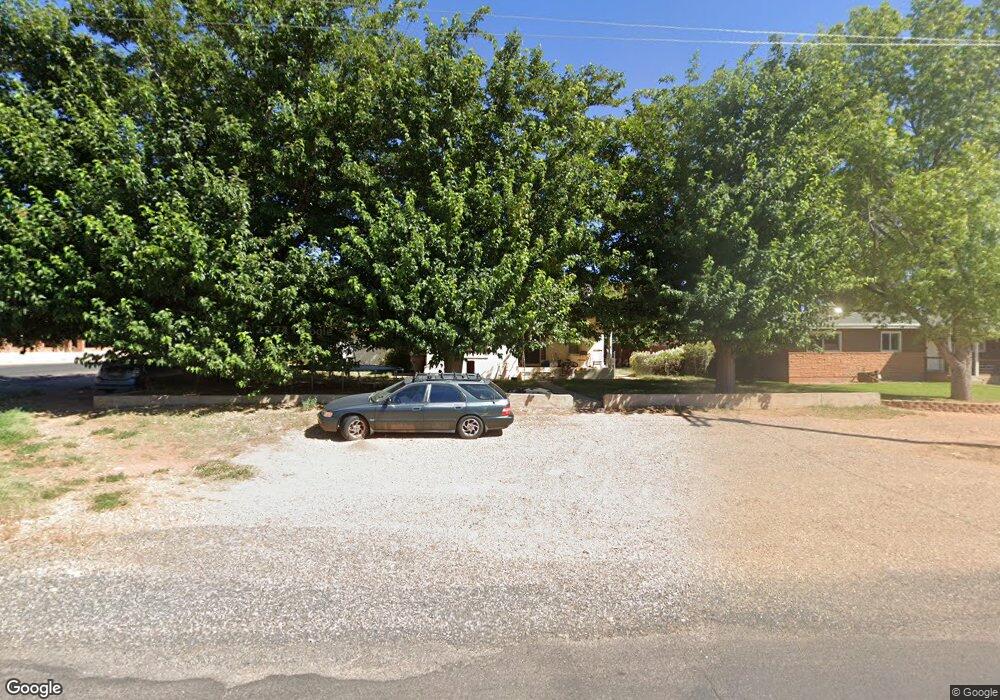
This home is located at 294 N 100 W, Kanab, UT 84741 and is currently estimated at $322,348, approximately $250 per square foot. 294 N 100 W is a home located in Kane County with nearby schools including Kanab Elementary School, Kanab Middle School, and Kanab High School.
Ownership History
Date
Name
Owned For
Owner Type
Purchase Details
Closed on
Jul 16, 2021
Sold by
Green Karen M
Bought by
Icenogle Jaron
Current Estimated Value
Purchase Details
Closed on
Apr 13, 2016
Sold by
King Brian P and King Shaina J
Bought by
Hegwood Glenda P and Hegwood Jason C
Purchase Details
Closed on
Mar 18, 2015
Bought by
Wells Fargo Bank Na
Purchase Details
Closed on
Sep 17, 2010
Sold by
Wells Fargo Bank Na
Bought by
Etitle Insurance Agency
Purchase Details
Closed on
May 6, 2009
Sold by
Wells Fargo Bank Na
Bought by
Etitle Insurance Agency
Purchase Details
Closed on
Jun 14, 2006
Sold by
Green Karen Marie
Bought by
Baca Joshua R and Baca Georgia C
Home Financials for this Owner
Home Financials are based on the most recent Mortgage that was taken out on this home.
Original Mortgage
$172,296
Interest Rate
6.55%
Create a Home Valuation Report for This Property
The Home Valuation Report is an in-depth analysis detailing your home's value as well as a comparison with similar homes in the area
Home Values in the Area
Average Home Value in this Area
Purchase History
We collect this data history from publicly available records. To have your information removed, we recommend requesting removal directly through your county’s website.
| Date | Buyer | Sale Price | Title Company |
|---|---|---|---|
| Icenogle Jaron | -- | -- | |
| Hegwood Glenda P | -- | -- | |
| Wells Fargo Bank Na | -- | -- | |
| Etitle Insurance Agency | -- | -- | |
| Etitle Insurance Agency | -- | -- | |
| Baca Joshua R | -- | -- |
Source: Public Records
Mortgage History
We collect this data history from publicly available records. To have your information removed, we recommend requesting removal directly through your county’s website.
| Date | Status | Borrower | Loan Amount |
|---|---|---|---|
| Previous Owner | Baca Joshua R | $172,296 |
Source: Public Records
Tax History
| Year | Tax Paid | Tax Assessment Tax Assessment Total Assessment is a certain percentage of the fair market value that is determined by local assessors to be the total taxable value of land and additions on the property. | Land | Improvement |
|---|---|---|---|---|
| 2025 | $1,135 | $240,479 | $102,829 | $137,650 |
| 2024 | $1,154 | $134,114 | $45,841 | $88,273 |
| 2023 | $1,041 | $123,906 | $43,658 | $80,248 |
| 2022 | $904 | $106,537 | $33,584 | $72,953 |
| 2021 | $821 | $145,223 | $46,970 | $98,253 |
| 2020 | $816 | $140,210 | $42,700 | $97,510 |
| 2019 | $842 | $140,866 | $43,956 | $96,910 |
| 2018 | $805 | $133,540 | $36,630 | $96,910 |
| 2017 | $784 | $124,153 | $33,300 | $90,853 |
| 2016 | $1,246 | $105,394 | $33,300 | $72,094 |
| 2015 | $677 | $99,116 | $33,300 | $65,816 |
| 2014 | $677 | $103,527 | $35,823 | $67,704 |
| 2013 | -- | $56,940 | $0 | $0 |
Source: Public Records
Map
Nearby Homes
Your Personal Tour Guide
Ask me questions while you tour the home.