Estimated Value: $380,669 - $414,000
--
Bed
--
Bath
2,482
Sq Ft
$160/Sq Ft
Est. Value
About This Home
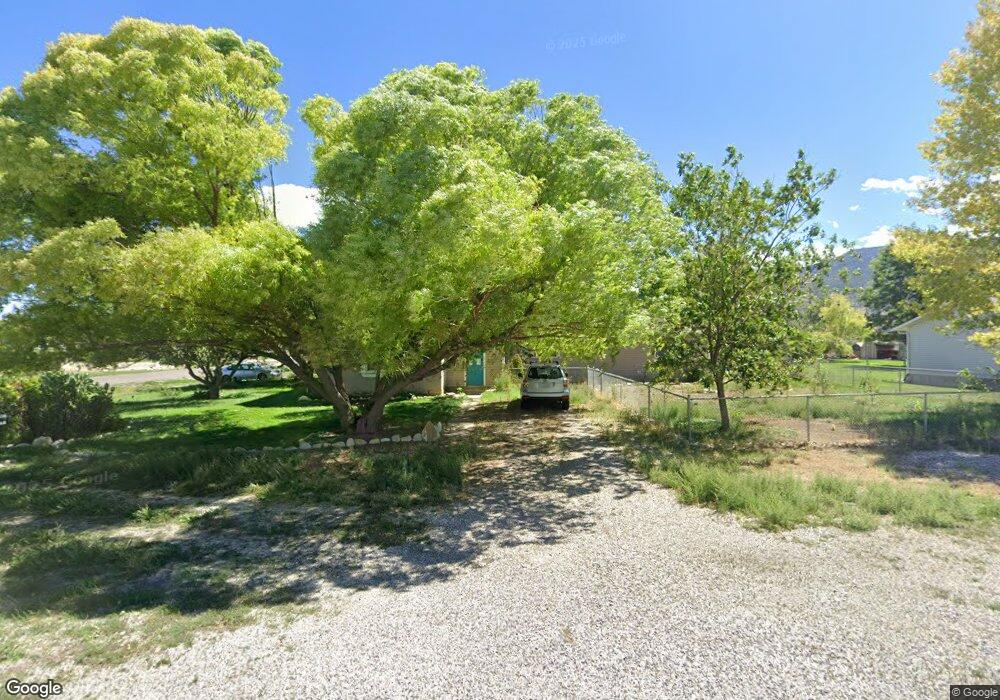
This home is located at 294 N 400 W, Manti, UT 84642 and is currently estimated at $397,917, approximately $160 per square foot. 294 N 400 W is a home.
Ownership History
Date
Name
Owned For
Owner Type
Purchase Details
Closed on
Jan 30, 2025
Sold by
Lithgow Helen M
Bought by
Sanders Kiley
Current Estimated Value
Home Financials for this Owner
Home Financials are based on the most recent Mortgage that was taken out on this home.
Original Mortgage
$380,000
Outstanding Balance
$373,336
Interest Rate
0.69%
Mortgage Type
Construction
Estimated Equity
$24,581
Purchase Details
Closed on
Aug 21, 2019
Sold by
Traina Alisha D
Bought by
Lithgow William B
Home Financials for this Owner
Home Financials are based on the most recent Mortgage that was taken out on this home.
Original Mortgage
$256,500
Interest Rate
3.7%
Mortgage Type
Construction
Purchase Details
Closed on
Feb 24, 2006
Sold by
Naylor Andrew G
Bought by
Naylor Andrew G and Naylor Alisha D
Purchase Details
Closed on
Feb 23, 2006
Sold by
Naylor Andrew G and Naylor Alisha D
Bought by
Naylor Andrew G
Purchase Details
Closed on
Jun 27, 2005
Sold by
Naylor Andrew G and Naylor Alisha D
Bought by
Naylor Andrew G and Naylor Alisha D
Create a Home Valuation Report for This Property
The Home Valuation Report is an in-depth analysis detailing your home's value as well as a comparison with similar homes in the area
Home Values in the Area
Average Home Value in this Area
Purchase History
| Date | Buyer | Sale Price | Title Company |
|---|---|---|---|
| Sanders Kiley | $475,000 | First American Title Ins Co | |
| Lithgow William B | -- | Central Utah Title | |
| Naylor Andrew G | -- | Central Utah Title | |
| Naylor Andrew G | -- | Central Utah Title | |
| Naylor Andrew G | -- | -- |
Source: Public Records
Mortgage History
| Date | Status | Borrower | Loan Amount |
|---|---|---|---|
| Open | Sanders Kiley | $380,000 | |
| Previous Owner | Lithgow William B | $256,500 |
Source: Public Records
Tax History Compared to Growth
Tax History
| Year | Tax Paid | Tax Assessment Tax Assessment Total Assessment is a certain percentage of the fair market value that is determined by local assessors to be the total taxable value of land and additions on the property. | Land | Improvement |
|---|---|---|---|---|
| 2024 | $2,043 | $196,349 | $0 | $0 |
| 2023 | $2,034 | $184,366 | $0 | $0 |
| 2022 | $1,866 | $154,203 | $0 | $0 |
| 2021 | $1,766 | $126,369 | $0 | $0 |
| 2020 | $1,647 | $110,855 | $0 | $0 |
| 2019 | $1,560 | $103,119 | $0 | $0 |
| 2018 | $1,403 | $163,034 | $33,561 | $129,473 |
| 2017 | $1,246 | $83,790 | $0 | $0 |
| 2016 | $1,174 | $79,001 | $0 | $0 |
| 2015 | $1,179 | $79,001 | $0 | $0 |
| 2014 | $1,156 | $79,001 | $0 | $0 |
| 2013 | $1,168 | $80,272 | $0 | $0 |
Source: Public Records
Map
Nearby Homes