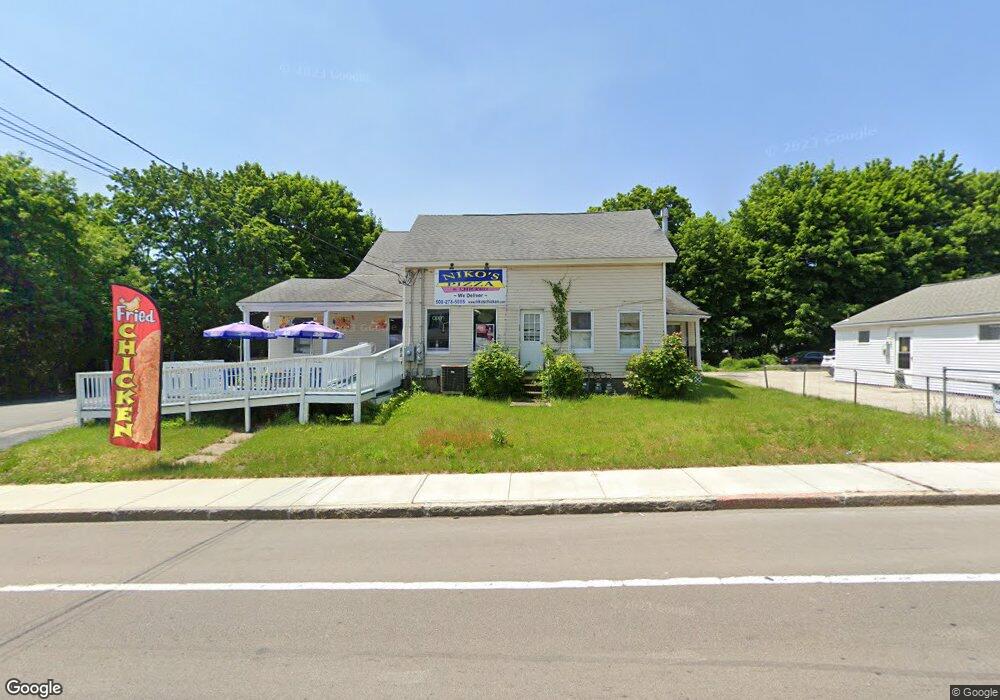
294 N Main St Uxbridge, MA 01569
Estimated Value: $439,216
5
Beds
1
Bath
6,510
Sq Ft
$67/Sq Ft
Est. Value
About This Home
This home is located at 294 N Main St, Uxbridge, MA 01569 and is currently estimated at $439,216, approximately $67 per square foot. 294 N Main St is a home located in Worcester County with nearby schools including Uxbridge High School, Our Lady of the Valley Regional School, and Whitinsville Christian School.
Ownership History
Date
Name
Owned For
Owner Type
Purchase Details
Closed on
Jul 21, 2008
Sold by
294 N Main St Llc
Bought by
Emmanuel Trust Corp
Current Estimated Value
Purchase Details
Closed on
Apr 23, 2007
Sold by
Shenouda Samir S
Bought by
294 N Main Street Llc
Purchase Details
Closed on
Sep 12, 2002
Sold by
Barsamian Gary and Barsamian Sharon
Bought by
Shenouda Samir S
Purchase Details
Closed on
Jul 6, 1993
Sold by
Touchette James E and Touchette Jean
Bought by
Barsamian Gary and Barsamian Sharon
Home Financials for this Owner
Home Financials are based on the most recent Mortgage that was taken out on this home.
Original Mortgage
$90,000
Interest Rate
7.46%
Mortgage Type
Commercial
Create a Home Valuation Report for This Property
The Home Valuation Report is an in-depth analysis detailing your home's value as well as a comparison with similar homes in the area
Home Values in the Area
Average Home Value in this Area
Purchase History
| Date | Buyer | Sale Price | Title Company |
|---|---|---|---|
| Emmanuel Trust Corp | -- | -- | |
| Emmanuel Trust Corp | -- | -- | |
| 294 N Main Street Llc | -- | -- | |
| 294 N Main Street Llc | -- | -- | |
| Shenouda Samir S | $181,000 | -- | |
| Shenouda Samir S | $181,000 | -- | |
| Barsamian Gary | $120,000 | -- | |
| Barsamian Gary | $120,000 | -- |
Source: Public Records
Mortgage History
| Date | Status | Borrower | Loan Amount |
|---|---|---|---|
| Previous Owner | Barsamian Gary | $90,000 | |
| Previous Owner | Barsamian Gary | $83,000 |
Source: Public Records
Tax History Compared to Growth
Tax History
| Year | Tax Paid | Tax Assessment Tax Assessment Total Assessment is a certain percentage of the fair market value that is determined by local assessors to be the total taxable value of land and additions on the property. | Land | Improvement |
|---|---|---|---|---|
| 2025 | $0 | $427,300 | $138,700 | $288,600 |
| 2024 | $5,544 | $414,800 | $138,700 | $276,100 |
| 2023 | $5,544 | $397,400 | $138,700 | $258,700 |
| 2022 | $5,831 | $384,600 | $133,400 | $251,200 |
| 2021 | $6,084 | $384,600 | $133,400 | $251,200 |
| 2020 | $5,586 | $333,700 | $99,400 | $234,300 |
| 2019 | $5,616 | $323,700 | $92,000 | $231,700 |
| 2018 | $5,553 | $323,400 | $92,000 | $231,400 |
| 2017 | $5,144 | $303,300 | $85,800 | $217,500 |
| 2016 | $5,789 | $329,500 | $137,900 | $191,600 |
| 2015 | $5,591 | $321,300 | $137,900 | $183,400 |
Source: Public Records
Map
Nearby Homes
- 307 N Main St
- 36 Elm St
- 3 Strathmore Shire Unit A
- 129 Elm St Unit Lot 7
- 48 Homeward Ave
- 72 Homeward Ave
- 0 Homestead Ave
- 50 Carrington Ln
- 35 Highland Park Unit 35
- 7 Jefferson Ct Unit 7
- 75 Lake St
- 235 Rivulet St
- 60 Tyler Dr
- 94 Heritage Dr Unit 94
- 0 Louis St
- 44 Arthur Dr Unit 44
- 99 Country Club Dr
- 20 Nature View Dr Unit 20
- 24 Olde Canal Way Unit 24
- Layla Plan at Pine Ridge