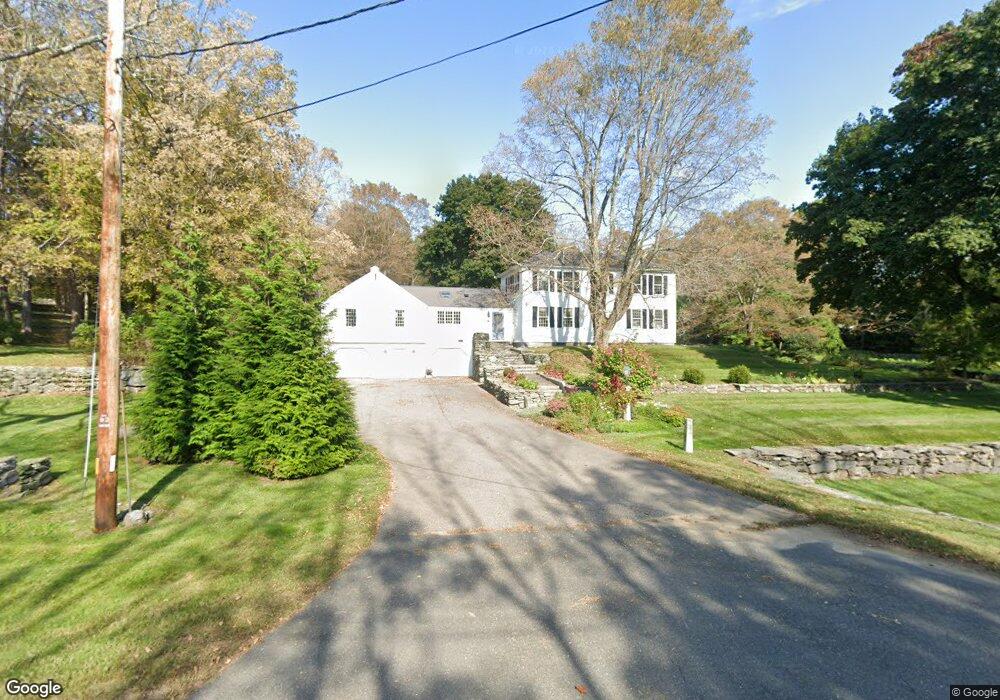
294 Petersham Rd Hardwick, MA 01037
Estimated Value: $576,715 - $737,000
4
Beds
3
Baths
3,794
Sq Ft
$167/Sq Ft
Est. Value
About This Home
This home is located at 294 Petersham Rd, Hardwick, MA 01037 and is currently estimated at $633,679, approximately $167 per square foot. 294 Petersham Rd is a home with nearby schools including Quabbin Regional Middle School, Quabbin Regional High School, and Eagle Hill School.
Ownership History
Date
Name
Owned For
Owner Type
Purchase Details
Closed on
Jul 22, 2021
Sold by
Matson Home 2 Inc
Bought by
Lindenmuth Angela M
Current Estimated Value
Home Financials for this Owner
Home Financials are based on the most recent Mortgage that was taken out on this home.
Original Mortgage
$464,700
Outstanding Balance
$421,121
Interest Rate
2.96%
Mortgage Type
Purchase Money Mortgage
Estimated Equity
$212,558
Purchase Details
Closed on
May 16, 2017
Sold by
Bleimann Kim D
Bought by
Kim D Bleimann Ret and Bleimann
Purchase Details
Closed on
Jan 9, 2012
Sold by
Gordon W Wood Ret
Bought by
Bleimann Kim
Purchase Details
Closed on
Aug 29, 2008
Sold by
Pitzi Susan D
Bought by
Shenhold Tr Daisy E and Shenholm Daisy E
Purchase Details
Closed on
Oct 2, 2006
Sold by
Pitzi Susan D
Bought by
Salvucci Danial and Anderson Douglas W
Create a Home Valuation Report for This Property
The Home Valuation Report is an in-depth analysis detailing your home's value as well as a comparison with similar homes in the area
Home Values in the Area
Average Home Value in this Area
Purchase History
| Date | Buyer | Sale Price | Title Company |
|---|---|---|---|
| Lindenmuth Angela M | $464,700 | None Available | |
| Kim D Bleimann Ret | -- | -- | |
| Bleimann Kim | $442,000 | -- | |
| Shenhold Tr Daisy E | $369,000 | -- | |
| Salvucci Danial | $20,000 | -- | |
| Kim D Bleimann Ret | -- | -- | |
| Shenhold Tr Daisy E | $369,000 | -- | |
| Salvucci Danial | $20,000 | -- |
Source: Public Records
Mortgage History
| Date | Status | Borrower | Loan Amount |
|---|---|---|---|
| Open | Lindenmuth Angela M | $464,700 |
Source: Public Records
Tax History Compared to Growth
Tax History
| Year | Tax Paid | Tax Assessment Tax Assessment Total Assessment is a certain percentage of the fair market value that is determined by local assessors to be the total taxable value of land and additions on the property. | Land | Improvement |
|---|---|---|---|---|
| 2025 | $6,920 | $526,200 | $79,200 | $447,000 |
| 2024 | $6,641 | $526,200 | $79,200 | $447,000 |
| 2023 | $6,703 | $504,000 | $75,700 | $428,300 |
| 2022 | $6,368 | $433,200 | $75,700 | $357,500 |
| 2021 | $6,150 | $391,000 | $75,000 | $316,000 |
| 2020 | $5,946 | $372,100 | $82,700 | $289,400 |
| 2019 | $5,713 | $356,200 | $82,700 | $273,500 |
| 2018 | $5,459 | $326,100 | $88,500 | $237,600 |
| 2017 | $9,302 | $326,100 | $88,500 | $237,600 |
| 2016 | $5,362 | $340,000 | $77,800 | $262,200 |
| 2015 | $5,257 | $330,600 | $79,400 | $251,200 |
Source: Public Records
Map
Nearby Homes
- LOT 2 Petersham Rd
- Lot 2 North Rd
- Lot 3 Clapp Rd
- 0/ 194 Old Greenwich Plains Rd
- Lot 3, 205 Upper Church St
- Lot 2, 205 Upper Church St
- Lot 5, 205 Upper Church St
- Lot 4, 205 Upper Church St
- 38 Gaudet Rd
- 1824 Greenwich Rd
- 1854 Greenwich Rd
- 1350 Thresher Rd
- 0 Lower Rd
- Delargy Rd
- 1107 Jackson Rd
- Lot 7 Delargy Rd
- 697 Lower Rd
- 201 Upper Church St
- 58 Ruggles St
- 2 Spring St
- 301 Petersham Rd
- 309 Petersham Rd
- 303 Petersham Rd
- 1 Old Petersham Rd
- 1 Old Petersham Rd
- 2468 Barre Rd
- 1 North Rd
- 3 Petersham Rd
- 44 Sessions Rd
- 73 Sessions Rd
- 221 Petersham Rd
- Lot 4 Petersham Rd
- Lot 2E Petersham Rd
- 207 Petersham Rd
- 108 North Rd
- 108 North Rd
- 99 Sessions Rd
- 170 Petersham Rd
- 00 Petersham Rd
- 170 Petersham Rd