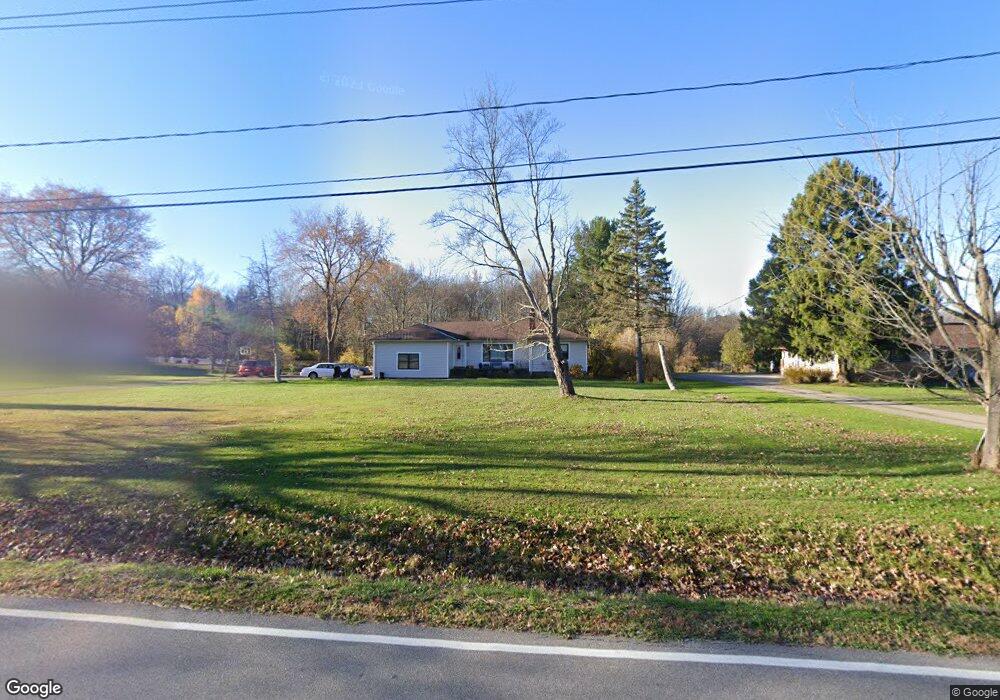
29400 Jackson Rd Chagrin Falls, OH 44022
Orange NeighborhoodEstimated Value: $368,000 - $477,000
3
Beds
2
Baths
1,756
Sq Ft
$242/Sq Ft
Est. Value
About This Home
This home is located at 29400 Jackson Rd, Chagrin Falls, OH 44022 and is currently estimated at $424,390, approximately $241 per square foot. 29400 Jackson Rd is a home located in Cuyahoga County with nearby schools including Moreland Hills Elementary School, Ballard Brady Middle School, and Orange High School.
Ownership History
Date
Name
Owned For
Owner Type
Purchase Details
Closed on
Oct 29, 2010
Sold by
Deutsch Ellen C
Bought by
Edwards Norman
Current Estimated Value
Home Financials for this Owner
Home Financials are based on the most recent Mortgage that was taken out on this home.
Original Mortgage
$183,315
Outstanding Balance
$120,825
Interest Rate
4.25%
Mortgage Type
FHA
Estimated Equity
$303,565
Purchase Details
Closed on
Nov 1, 2004
Sold by
Deutsch Ellen C
Bought by
Deutsch Ellen C and The Ellen C Deutsch Trust Agreement
Purchase Details
Closed on
Aug 8, 1980
Bought by
Deutsch Ellen C
Purchase Details
Closed on
Aug 22, 1979
Sold by
Sigman William Jay
Bought by
The Equitable Life Assurance
Purchase Details
Closed on
Nov 24, 1978
Sold by
Ptak Richard F and Ptak Madeline E
Bought by
Sigman William Jay
Purchase Details
Closed on
Jan 1, 1975
Bought by
Ptak Richard F and Ptak Madeline E
Create a Home Valuation Report for This Property
The Home Valuation Report is an in-depth analysis detailing your home's value as well as a comparison with similar homes in the area
Home Values in the Area
Average Home Value in this Area
Purchase History
| Date | Buyer | Sale Price | Title Company |
|---|---|---|---|
| Edwards Norman | $195,000 | Erie View | |
| Deutsch Ellen C | -- | Attorney | |
| Deutsch Ellen C | $87,500 | -- | |
| The Equitable Life Assurance | $95,500 | -- | |
| Sigman William Jay | $90,000 | -- | |
| Ptak Richard F | -- | -- |
Source: Public Records
Mortgage History
| Date | Status | Borrower | Loan Amount |
|---|---|---|---|
| Open | Edwards Norman | $183,315 |
Source: Public Records
Tax History Compared to Growth
Tax History
| Year | Tax Paid | Tax Assessment Tax Assessment Total Assessment is a certain percentage of the fair market value that is determined by local assessors to be the total taxable value of land and additions on the property. | Land | Improvement |
|---|---|---|---|---|
| 2024 | $7,236 | $133,525 | $26,635 | $106,890 |
| 2023 | $4,945 | $77,910 | $21,560 | $56,350 |
| 2022 | $4,952 | $77,910 | $21,560 | $56,350 |
| 2021 | $5,025 | $77,910 | $21,560 | $56,350 |
| 2020 | $5,017 | $74,200 | $20,550 | $53,660 |
| 2019 | $4,843 | $212,000 | $58,700 | $153,300 |
| 2018 | $4,813 | $74,200 | $20,550 | $53,660 |
| 2017 | $5,141 | $75,570 | $18,520 | $57,050 |
| 2016 | $5,188 | $75,570 | $18,520 | $57,050 |
| 2015 | $4,638 | $75,570 | $18,520 | $57,050 |
| 2014 | $4,638 | $65,700 | $16,100 | $49,600 |
Source: Public Records
Map
Nearby Homes
- 4360 S Hilltop Rd
- 28649 Jackson Rd
- 625 Lake Placid Ct S
- 29650 N Hilltop Rd
- 4420 Lander Rd
- 28200 Pike Dr
- 110 Lake Balaton Dr
- Bourges Plan at Lakes of Orange - The Estates Series
- Skyview Plan at Lakes of Orange - The Estates Series
- Deer Valley Plan at Lakes of Orange - The Estates Series
- 30710 Harvard Rd
- 516 Crystal Lake Dr N
- 186 Lake Balaton Dr
- 4860 Brainard Rd
- 247 Lake Meade Dr
- 300 Woodridge Ln
- 26736 Rue Saint Anne Ct
- 143 Blossom Ln Unit 6
- 3870 Beechmont Oval
- 355 Tahoe Trail
- 29350 Jackson Rd
- 29450 Jackson Rd
- 29250 Jackson Rd
- 29399 Jackson Rd
- 29449 Jackson Rd
- 29500 Jackson Rd
- 29279 Jackson Rd
- 29150 Jackson Rd
- 29549 Jackson Rd
- 29229 Jackson Rd
- 29550 Jackson Rd
- 29000 Jackson Rd
- 4399 Orangedale Rd
- 29649 Jackson Rd
- 29149 Jackson Rd
- 29650 Jackson Rd
- 28900 Jackson Rd
- 4389 Orangedale Rd
- 29011 Jackson Rd
- 29699 Jackson Rd