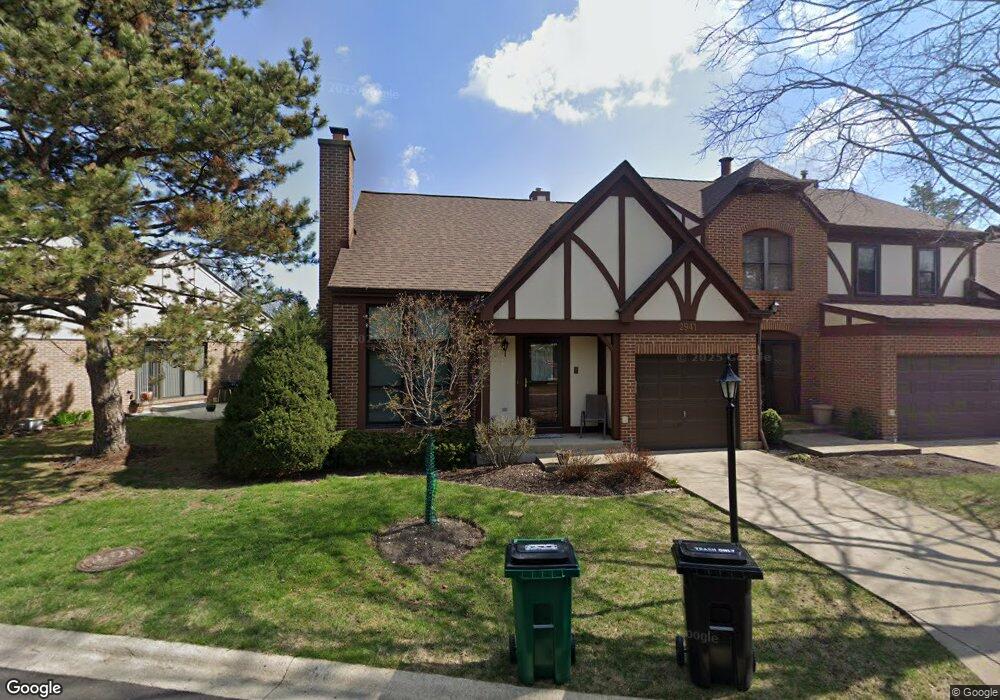
2941 Ashton Ct Westchester, IL 60154
Estimated Value: $325,000 - $339,000
2
Beds
2
Baths
1,473
Sq Ft
$227/Sq Ft
Est. Value
About This Home
This home is located at 2941 Ashton Ct, Westchester, IL 60154 and is currently estimated at $334,268, approximately $226 per square foot. 2941 Ashton Ct is a home located in Cook County with nearby schools including Westchester Primary School, Westchester Intermediate School, and Westchester Middle School.
Ownership History
Date
Name
Owned For
Owner Type
Purchase Details
Closed on
Feb 13, 2007
Sold by
Sima Joseph J
Bought by
Schaffer Farhi Jean M
Current Estimated Value
Home Financials for this Owner
Home Financials are based on the most recent Mortgage that was taken out on this home.
Original Mortgage
$230,000
Outstanding Balance
$138,601
Interest Rate
6.27%
Mortgage Type
Unknown
Estimated Equity
$195,667
Purchase Details
Closed on
Feb 15, 2000
Sold by
Sima Joseph J
Bought by
Sima Joseph J and Joseph J Sima Living Trust
Create a Home Valuation Report for This Property
The Home Valuation Report is an in-depth analysis detailing your home's value as well as a comparison with similar homes in the area
Home Values in the Area
Average Home Value in this Area
Purchase History
| Date | Buyer | Sale Price | Title Company |
|---|---|---|---|
| Schaffer Farhi Jean M | $295,000 | Git | |
| Sima Joseph J | -- | -- |
Source: Public Records
Mortgage History
| Date | Status | Borrower | Loan Amount |
|---|---|---|---|
| Open | Schaffer Farhi Jean M | $230,000 |
Source: Public Records
Tax History Compared to Growth
Tax History
| Year | Tax Paid | Tax Assessment Tax Assessment Total Assessment is a certain percentage of the fair market value that is determined by local assessors to be the total taxable value of land and additions on the property. | Land | Improvement |
|---|---|---|---|---|
| 2024 | $6,741 | $29,000 | $2,612 | $26,388 |
| 2023 | $5,284 | $29,000 | $2,612 | $26,388 |
| 2022 | $5,284 | $20,741 | $2,961 | $17,780 |
| 2021 | $5,141 | $20,740 | $2,960 | $17,780 |
| 2020 | $5,089 | $20,740 | $2,960 | $17,780 |
| 2019 | $5,341 | $22,334 | $2,699 | $19,635 |
| 2018 | $5,269 | $22,334 | $2,699 | $19,635 |
| 2017 | $5,184 | $22,334 | $2,699 | $19,635 |
| 2016 | $4,968 | $19,533 | $2,438 | $17,095 |
| 2015 | $4,868 | $19,533 | $2,438 | $17,095 |
| 2014 | $4,771 | $19,533 | $2,438 | $17,095 |
| 2013 | $4,435 | $20,272 | $2,438 | $17,834 |
Source: Public Records
Map
Nearby Homes
- 2925 Denton Ct
- 16 Princess Ct Unit 16
- 3036 Downing Ave
- 10916 Kingston St
- 2610 Sunnyside Ave
- 2623 Sunnyside Ave
- 2401 Mayfair Ave
- 11140 Windsor Dr
- 2337 Kensington Ave
- 10610 Essex St
- 10511 Preston St
- 2228 High Ridge Pkwy
- 2230 Kensington Ave
- 11449 Prescott Ln
- 2550 Camberley Cir Unit 5-810
- 11513 Enterprise Dr
- 2205 Mayfair Ave
- 638 N Edgewood Ave
- 2130 Mandel Ave
- 11148 Shelley St