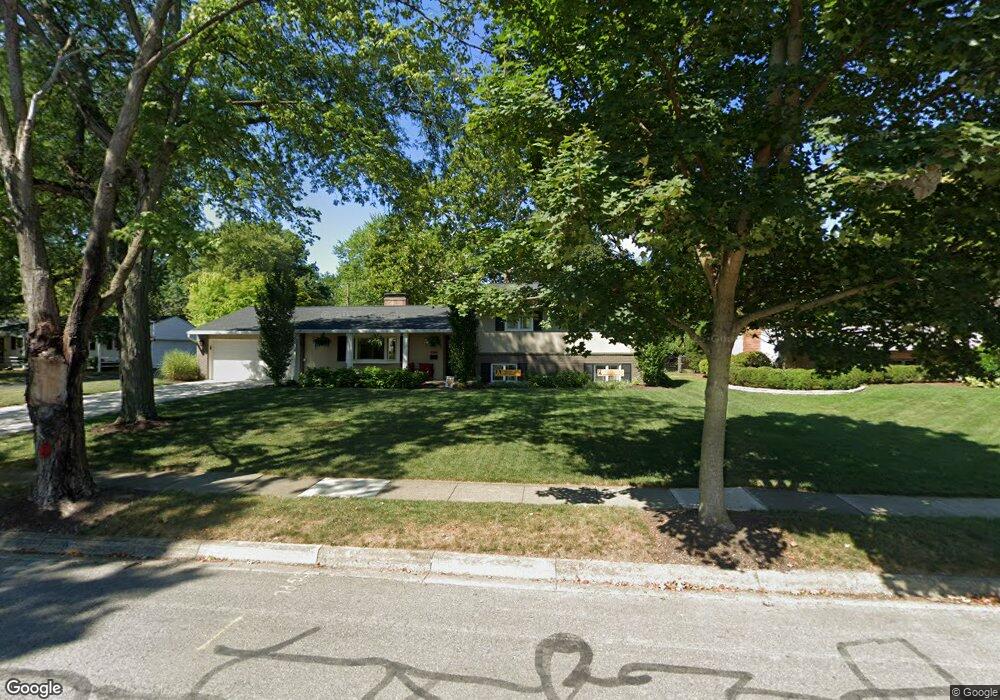
2941 Pickwick Dr Columbus, OH 43221
Estimated Value: $695,000 - $811,000
4
Beds
3
Baths
2,895
Sq Ft
$263/Sq Ft
Est. Value
About This Home
This home is located at 2941 Pickwick Dr, Columbus, OH 43221 and is currently estimated at $761,348, approximately $262 per square foot. 2941 Pickwick Dr is a home located in Franklin County with nearby schools including Tremont Elementary School, Jones Middle School, and Upper Arlington High School.
Ownership History
Date
Name
Owned For
Owner Type
Purchase Details
Closed on
Dec 23, 2011
Sold by
Norris Steven F and Norris Judy R
Bought by
Beckstedt Robb A and Beckstedt Susan E
Current Estimated Value
Home Financials for this Owner
Home Financials are based on the most recent Mortgage that was taken out on this home.
Original Mortgage
$230,000
Outstanding Balance
$155,380
Interest Rate
3.98%
Mortgage Type
New Conventional
Estimated Equity
$605,968
Purchase Details
Closed on
Apr 20, 1998
Sold by
House Kim M & Tina M
Bought by
Norris Steven F and Norris Judy R
Purchase Details
Closed on
Dec 24, 1996
Sold by
Maloney Jacqueline A
Bought by
Kim M & Tina M House
Home Financials for this Owner
Home Financials are based on the most recent Mortgage that was taken out on this home.
Original Mortgage
$141,000
Interest Rate
7.74%
Mortgage Type
New Conventional
Create a Home Valuation Report for This Property
The Home Valuation Report is an in-depth analysis detailing your home's value as well as a comparison with similar homes in the area
Home Values in the Area
Average Home Value in this Area
Purchase History
| Date | Buyer | Sale Price | Title Company |
|---|---|---|---|
| Beckstedt Robb A | $290,000 | Talon Title A | |
| Norris Steven F | $208,000 | Chicago Title West | |
| Kim M & Tina M House | $193,500 | -- |
Source: Public Records
Mortgage History
| Date | Status | Borrower | Loan Amount |
|---|---|---|---|
| Open | Beckstedt Robb A | $230,000 | |
| Previous Owner | Kim M & Tina M House | $141,000 |
Source: Public Records
Tax History
| Year | Tax Paid | Tax Assessment Tax Assessment Total Assessment is a certain percentage of the fair market value that is determined by local assessors to be the total taxable value of land and additions on the property. | Land | Improvement |
|---|---|---|---|---|
| 2025 | $11,584 | $200,100 | $74,520 | $125,580 |
| 2024 | $11,584 | $200,100 | $74,520 | $125,580 |
| 2023 | $11,441 | $200,100 | $74,520 | $125,580 |
| 2022 | $11,414 | $163,350 | $57,370 | $105,980 |
| 2021 | $10,104 | $163,350 | $57,370 | $105,980 |
| 2020 | $10,015 | $163,350 | $57,370 | $105,980 |
| 2019 | $9,170 | $132,240 | $57,370 | $74,870 |
| 2018 | $8,040 | $132,240 | $57,370 | $74,870 |
| 2017 | $9,100 | $132,240 | $57,370 | $74,870 |
| 2016 | $6,968 | $105,390 | $41,410 | $63,980 |
| 2015 | $6,962 | $105,390 | $41,410 | $63,980 |
| 2014 | $6,970 | $105,390 | $41,410 | $63,980 |
| 2013 | $3,328 | $95,795 | $37,625 | $58,170 |
Source: Public Records
Map
Nearby Homes
- 2803 N Star Rd
- 1485 Trentwood Rd
- 3190 Kenny Rd
- 3336 Mansion Way
- 1530 Pemberton Dr
- 2585 Westmont Blvd
- 1744 Ridgecliff Rd Unit 12
- 3175 Tremont Rd Unit 313
- 1872 Kentwell Rd Unit 1872
- 1121 Afton Rd
- 959 Caniff Place
- 3106 Somerford Rd
- 1842 Ridgecliff Rd
- 2026 Jervis Rd
- 1565 Berkshire Rd
- 936 Havendale Dr
- 2583 Wexford Rd
- 667 Riverview Dr
- 1869 Tewksbury Rd
- 1224 Kenbrook Hills Dr Unit 25
- 2955 Pickwick Dr
- 2929 Pickwick Dr
- 2948 Halstead Rd
- 2960 Halstead Rd
- 2936 Halstead Rd
- 2919 Pickwick Dr
- 2965 Pickwick Dr
- 2942 Halstead Rd
- 2938 Halstead Rd
- 2946 Halstead Rd
- 2934 Halstead Rd
- 2950 Halstead Rd
- 2930 Halstead Rd
- 2940 Pickwick Dr
- 2970 Halstead Rd
- 2920 Halstead Rd
- 2952 Pickwick Dr
- 2916 Halstead Rd
- 2926 Pickwick Dr
- 2924 Halstead Rd
Your Personal Tour Guide
Ask me questions while you tour the home.