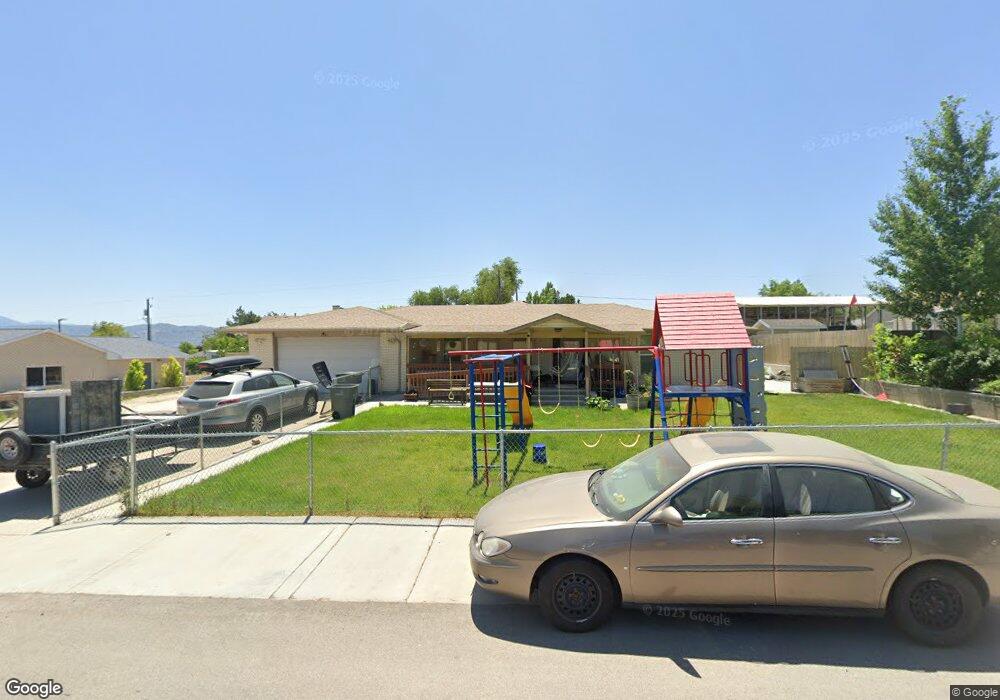
2941 W 10460 S South Jordan, UT 84095
Estimated Value: $831,000 - $933,197
5
Beds
5
Baths
4,243
Sq Ft
$209/Sq Ft
Est. Value
About This Home
This home is located at 2941 W 10460 S, South Jordan, UT 84095 and is currently estimated at $888,549, approximately $209 per square foot. 2941 W 10460 S is a home located in Salt Lake County with nearby schools including Monte Vista Elementary School, South Jordan Middle School, and Stillwater Academy.
Ownership History
Date
Name
Owned For
Owner Type
Purchase Details
Closed on
Jun 22, 2023
Sold by
Garcia-Fierro Carlos
Bought by
Gale Misty D
Current Estimated Value
Purchase Details
Closed on
Mar 23, 2023
Sold by
Gale Misty
Bought by
G & G Investment Properties Ll
Purchase Details
Closed on
Nov 13, 2020
Sold by
Benneit Lisa T
Bought by
Garcia Fierro Carlos and Gale Misty
Purchase Details
Closed on
May 14, 2018
Sold by
Bennett Robert T
Bought by
Bennett Lisa T
Purchase Details
Closed on
Mar 4, 2015
Sold by
Fannie Mae
Bought by
Bennett Robert T and Bennett Lisa T
Home Financials for this Owner
Home Financials are based on the most recent Mortgage that was taken out on this home.
Original Mortgage
$328,494
Interest Rate
3.57%
Mortgage Type
VA
Purchase Details
Closed on
Aug 12, 2014
Sold by
Bank Of America Na
Bought by
Federal National Mortgage Association
Purchase Details
Closed on
Aug 6, 2014
Sold by
Patrick Robin L
Bought by
Bank Of America Na
Purchase Details
Closed on
Jul 23, 2008
Sold by
Patrick Robin L
Bought by
Patrick Robin L and Patrick Kenra L
Purchase Details
Closed on
Mar 27, 2007
Sold by
Gladys Properties Llc
Bought by
Patrick Robin L
Home Financials for this Owner
Home Financials are based on the most recent Mortgage that was taken out on this home.
Original Mortgage
$315,000
Interest Rate
6.29%
Mortgage Type
New Conventional
Purchase Details
Closed on
Aug 9, 2006
Sold by
Allphin David A
Bought by
Gladys Properties Llc
Purchase Details
Closed on
Aug 3, 2006
Sold by
Richards Beverly B
Bought by
Allphin David A
Purchase Details
Closed on
Oct 7, 1998
Sold by
Bell Cynthia
Bought by
Swapp Spencer
Purchase Details
Closed on
Oct 20, 1996
Sold by
Spencer Leasing Systems Inc
Bought by
Bell Cynthia L
Purchase Details
Closed on
Oct 3, 1996
Sold by
Bell Cynthia
Bought by
Spencer Leasing Systems Inc
Create a Home Valuation Report for This Property
The Home Valuation Report is an in-depth analysis detailing your home's value as well as a comparison with similar homes in the area
Home Values in the Area
Average Home Value in this Area
Purchase History
| Date | Buyer | Sale Price | Title Company |
|---|---|---|---|
| Gale Misty D | -- | None Listed On Document | |
| G & G Investment Properties Ll | -- | -- | |
| Gale Misty | -- | -- | |
| Gale Misty | -- | -- | |
| Garcia Fierro Carlos | -- | Gt Title Services Slc | |
| Bennett Lisa T | -- | None Available | |
| Bennett Lisa T | -- | None Available | |
| Bennett Robert T | -- | Orange Title Ins Agcy | |
| Federal National Mortgage Association | -- | Orange Title Ins Agency | |
| Bank Of America Na | $310,500 | Orange Title Ins Agcy | |
| Patrick Robin L | -- | None Available | |
| Patrick Robin L | -- | Affiliated First Title | |
| Gladys Properties Llc | -- | Affiliated First Title | |
| Allphin David A | -- | Affiliated First Title | |
| Swapp Spencer | -- | -- | |
| Bell Cynthia L | -- | -- | |
| Spencer Leasing Systems Inc | -- | -- |
Source: Public Records
Mortgage History
| Date | Status | Borrower | Loan Amount |
|---|---|---|---|
| Previous Owner | Bennett Robert T | $328,494 | |
| Previous Owner | Patrick Robin L | $315,000 |
Source: Public Records
Tax History Compared to Growth
Tax History
| Year | Tax Paid | Tax Assessment Tax Assessment Total Assessment is a certain percentage of the fair market value that is determined by local assessors to be the total taxable value of land and additions on the property. | Land | Improvement |
|---|---|---|---|---|
| 2025 | $3,980 | $867,900 | $255,300 | $612,600 |
| 2024 | $3,980 | $755,600 | $240,900 | $514,700 |
| 2023 | $4,151 | $743,600 | $238,600 | $505,000 |
| 2022 | $4,290 | $753,300 | $233,900 | $519,400 |
| 2021 | $3,568 | $574,800 | $178,500 | $396,300 |
| 2020 | $2,978 | $449,700 | $178,500 | $271,200 |
| 2019 | $3,040 | $451,200 | $178,500 | $272,700 |
| 2018 | $232 | $412,500 | $124,300 | $288,200 |
| 2017 | $2,561 | $370,700 | $124,300 | $246,400 |
| 2016 | $2,515 | $344,900 | $124,300 | $220,600 |
| 2015 | $2,229 | $297,300 | $134,700 | $162,600 |
| 2014 | $2,172 | $284,600 | $127,700 | $156,900 |
Source: Public Records
Map
Nearby Homes
- 2908 W Bison Ridge Rd
- 2777 W Urban Ridge Rd
- 10688 S Bison Creek Cove Unit 20
- 3211 W Harvest Glory Dr
- 10320 S 2700 W
- 2866 W 10755 S
- 2929 W 10755 S
- 10177 Statesman Place
- 3274 W Harvest Chase Dr
- 10605 Willow Valley Rd
- 3312 W Harvest Grove Way
- 1553 W Banner Dr Unit 844
- 1578 W Banner Dr Unit 745
- 1558 W Banner Dr Unit 805
- 1574 W Banner Dr Unit 743
- 1576 W Banner Dr Unit 744
- 1556 W Banner Dr Unit 806
- 1548 W Banner Dr Unit 809
- 1552 W Banner Dr Unit 807
- Beatrix Plan at McKee Farms
- 2917 W 10460 S
- 2971 W 10460 S
- 2882 W 10545 S
- 2893 W 10460 S
- 10475 S 3010 W
- 2940 W 10460 S
- 2916 W 10460 S
- 2972 W 10460 S
- 10501 S 3010 W
- 2892 W 10460 S
- 10443 S 3010 W
- 2942 W 10545 S
- 2869 W 10460 S
- 10537 S 3010 W
- 10484 S 3010 W
- 10500 S 3010 W
- 2868 W 10460 S
- 2915 W South Jordan Pkwy
- 2891 W South Jordan Pkwy
- 10456 S 3010 W