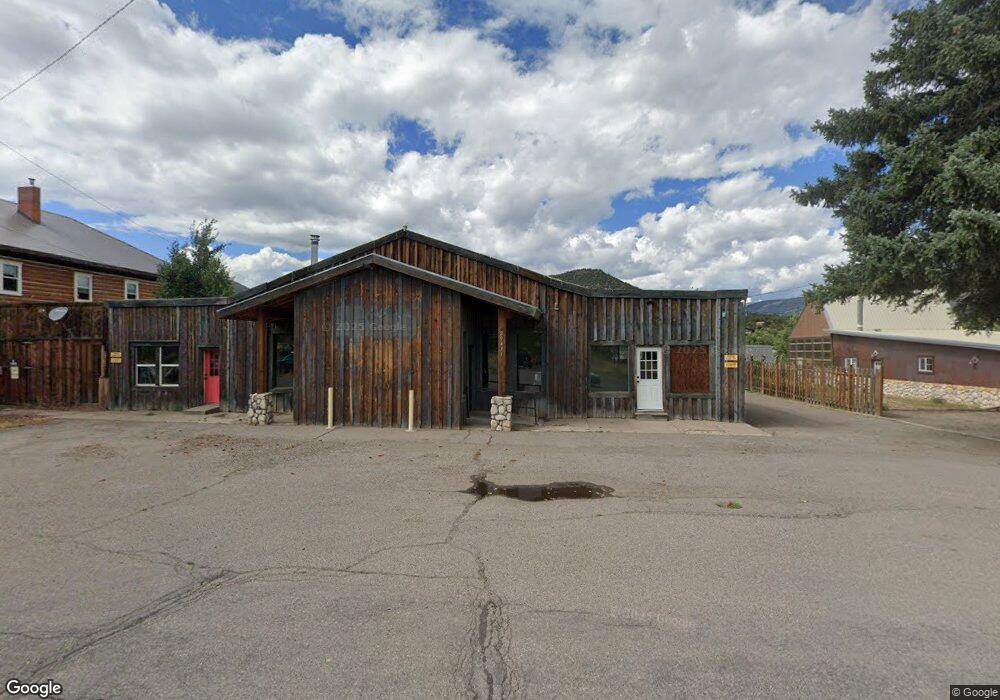
29411 Us Highway 160 South Fork, CO 81154
Estimated Value: $397,146
--
Bed
3
Baths
4,048
Sq Ft
$98/Sq Ft
Est. Value
About This Home
This home is located at 29411 Us Highway 160, South Fork, CO 81154 and is currently estimated at $397,146, approximately $98 per square foot. 29411 Us Highway 160 is a home located in Rio Grande County with nearby schools including Del Norte K-8 School and Del Norte High School.
Ownership History
Date
Name
Owned For
Owner Type
Purchase Details
Closed on
Nov 26, 2024
Sold by
Bl Investments Inc and Bl Investments Llc
Bought by
Leders Llc
Current Estimated Value
Purchase Details
Closed on
Jan 9, 2023
Sold by
Gorton Tanya
Bought by
Bl Investments Llc
Purchase Details
Closed on
Aug 23, 2021
Sold by
Schmidt Tyler and Schmidt Linette Nye
Bought by
Gorton Tanya
Purchase Details
Closed on
Aug 3, 2021
Sold by
Schmidt Tyler and Schmidt Linette Nye
Bought by
Gorton Tanya
Purchase Details
Closed on
May 20, 2016
Sold by
Brown Tyler J
Bought by
Schmidt Tyler and Schmidt Linette Nye
Home Financials for this Owner
Home Financials are based on the most recent Mortgage that was taken out on this home.
Original Mortgage
$80,000
Interest Rate
3.59%
Mortgage Type
Commercial
Purchase Details
Closed on
May 31, 2007
Sold by
South Fork Ranches Llc
Bought by
Brown Tyler J
Create a Home Valuation Report for This Property
The Home Valuation Report is an in-depth analysis detailing your home's value as well as a comparison with similar homes in the area
Home Values in the Area
Average Home Value in this Area
Purchase History
| Date | Buyer | Sale Price | Title Company |
|---|---|---|---|
| Leders Llc | -- | None Listed On Document | |
| Bl Investments Llc | -- | -- | |
| Bl Investments Llc | $230,000 | -- | |
| Gorton Tanya | $345,000 | None Available | |
| Gorton Tanya | -- | None Available | |
| Schmidt Tyler | -- | None Available | |
| Schmidt Tyler | $195,000 | None Available | |
| Brown Tyler J | -- | None Available |
Source: Public Records
Mortgage History
| Date | Status | Borrower | Loan Amount |
|---|---|---|---|
| Previous Owner | Schmidt Tyler | $80,000 | |
| Previous Owner | Schmidt Tyler | $115,000 |
Source: Public Records
Tax History Compared to Growth
Tax History
| Year | Tax Paid | Tax Assessment Tax Assessment Total Assessment is a certain percentage of the fair market value that is determined by local assessors to be the total taxable value of land and additions on the property. | Land | Improvement |
|---|---|---|---|---|
| 2024 | $1,079 | $16,644 | $12,499 | $4,145 |
| 2023 | $1,079 | $66,706 | $12,499 | $54,207 |
| 2022 | $3,633 | $55,846 | $7,665 | $48,181 |
| 2021 | $3,573 | $55,846 | $7,665 | $48,181 |
| 2020 | $3,588 | $55,846 | $7,665 | $48,181 |
| 2019 | $3,594 | $55,846 | $7,665 | $48,181 |
| 2018 | $3,262 | $50,420 | $0 | $0 |
| 2017 | $3,290 | $50,420 | $0 | $0 |
| 2016 | $2,086 | $41,281 | $0 | $0 |
| 2015 | $2,283 | $41,281 | $0 | $0 |
| 2014 | $2,283 | $45,057 | $0 | $0 |
| 2013 | $2,164 | $45,057 | $0 | $0 |
Source: Public Records
Map
Nearby Homes
- 80 Iron Bridge Ct
- 81 Rio Vista Cir
- 57 Dennette Ln
- 113 Buffalo Ct
- 173 Bonnaville Dr
- 20 E Riverside Ct
- 404 Vista de Verde Cir
- 461 Vista de Verde Cir
- 230 Orville Way
- 222 La Lomita Cir
- 117 Bonnaville Dr
- 311 Vista de Verde Cir
- 121 Bonnaville Dr
- T-1 Four Seasons Dr
- 76 W Riverside Ct
- 273 Vista de Verde Cir
- 237 Vista de Verde Cir
- 146 W Riverside Ct
- 188 W Riverside Ct
- 132 W Riverside Ct
- 0000 Wolf Creek Rd
- 29373 U S 160
- 29373 Us Highway 160
- 29291 Us Highway 160
- 29337 U S 160
- 0060 Iron Bridge Ct
- 60 Iron Bridge Ct
- 70 Iron Bridge Ct
- 70 Iron Bridge
- 0 Iron Bridge Ct Unit 659780
- 0 Iron Bridge Ct Unit 684290
- 0 Iron Bridge Ct Unit 695273
- 0 Iron Bridge Ct Unit 623186
- 0 Iron Bridge Ct Unit 714208
- 0 Iron Bridge Ct Unit 714997
- 48 Iron Bridge Place
- 48 Iron Bridge Place
- 29327 Us Highway 160
- 2931 Us Hwy 160
- 36 Iron Bridge Place