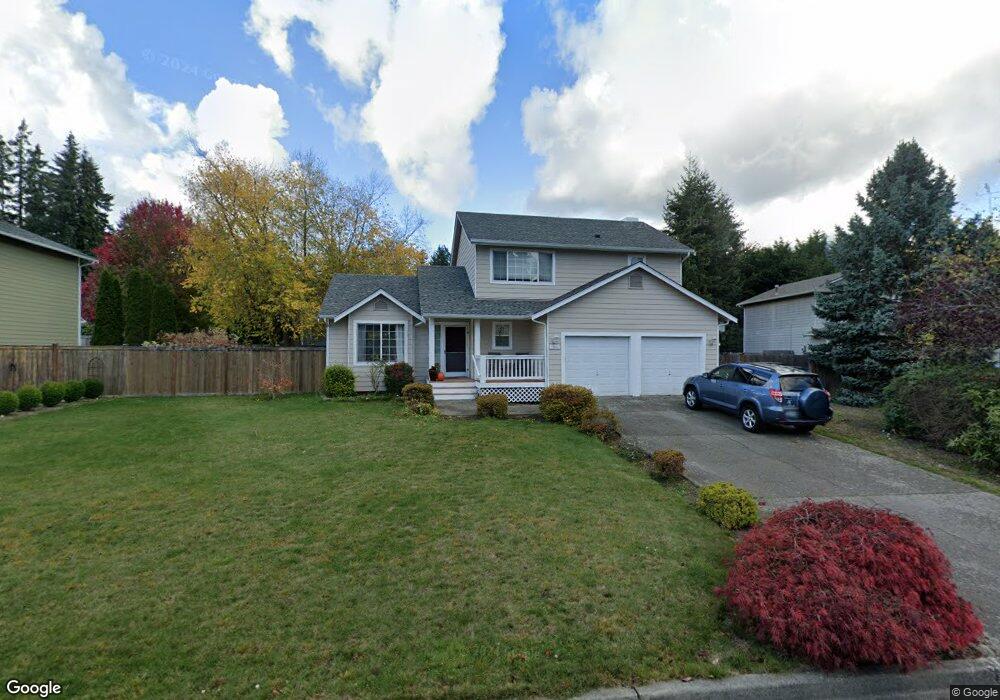
2942 NE Spartan Ct Poulsbo, WA 98370
Estimated Value: $567,352 - $678,000
3
Beds
3
Baths
1,604
Sq Ft
$383/Sq Ft
Est. Value
About This Home
This home is located at 2942 NE Spartan Ct, Poulsbo, WA 98370 and is currently estimated at $615,088, approximately $383 per square foot. 2942 NE Spartan Ct is a home located in Kitsap County with nearby schools including Poulsbo Elementary School, Poulsbo Middle School, and North Kitsap High School.
Ownership History
Date
Name
Owned For
Owner Type
Purchase Details
Closed on
Oct 18, 2011
Sold by
Whitney Bernard A
Bought by
Whitney Carol I
Current Estimated Value
Purchase Details
Closed on
Dec 1, 2010
Sold by
Whitney Bernard A
Bought by
Whitney Carol I
Purchase Details
Closed on
Aug 17, 2006
Sold by
Meek Adam C and Meek Angela G
Bought by
Whitney Bernard A and Whitney Carol I
Home Financials for this Owner
Home Financials are based on the most recent Mortgage that was taken out on this home.
Original Mortgage
$272,000
Interest Rate
6.76%
Mortgage Type
New Conventional
Purchase Details
Closed on
Sep 13, 1996
Sold by
Silverwood Homes Inc
Bought by
Meek Adam C and Meek Angela G
Home Financials for this Owner
Home Financials are based on the most recent Mortgage that was taken out on this home.
Original Mortgage
$130,850
Interest Rate
7.88%
Purchase Details
Closed on
Sep 21, 1995
Sold by
Tri Star Investment Company
Bought by
Hood R Kent and Hood Helen A
Home Financials for this Owner
Home Financials are based on the most recent Mortgage that was taken out on this home.
Original Mortgage
$113,600
Interest Rate
7.97%
Mortgage Type
Construction
Create a Home Valuation Report for This Property
The Home Valuation Report is an in-depth analysis detailing your home's value as well as a comparison with similar homes in the area
Home Values in the Area
Average Home Value in this Area
Purchase History
| Date | Buyer | Sale Price | Title Company |
|---|---|---|---|
| Whitney Carol I | -- | None Available | |
| Whitney Carol I | -- | None Available | |
| Whitney Bernard A | $340,280 | Transnation Title | |
| Meek Adam C | $134,900 | Transnation Title Insurance | |
| Hood R Kent | $32,000 | Land Title Company |
Source: Public Records
Mortgage History
| Date | Status | Borrower | Loan Amount |
|---|---|---|---|
| Previous Owner | Whitney Bernard A | $272,000 | |
| Previous Owner | Meek Adam C | $130,850 | |
| Previous Owner | Hood R Kent | $113,600 |
Source: Public Records
Tax History Compared to Growth
Tax History
| Year | Tax Paid | Tax Assessment Tax Assessment Total Assessment is a certain percentage of the fair market value that is determined by local assessors to be the total taxable value of land and additions on the property. | Land | Improvement |
|---|---|---|---|---|
| 2026 | $4,341 | $493,360 | $125,570 | $367,790 |
| 2025 | $4,341 | $493,360 | $125,570 | $367,790 |
| 2024 | $3,943 | $461,870 | $117,420 | $344,450 |
| 2023 | $4,010 | $461,870 | $117,420 | $344,450 |
| 2022 | $3,555 | $390,070 | $101,930 | $288,140 |
| 2021 | $3,439 | $349,670 | $91,330 | $258,340 |
| 2020 | $3,341 | $333,990 | $87,250 | $246,740 |
| 2019 | $3,133 | $313,380 | $81,540 | $231,840 |
| 2018 | $2,889 | $245,690 | $61,580 | $184,110 |
| 2017 | $2,754 | $245,690 | $61,580 | $184,110 |
| 2016 | $2,831 | $232,540 | $61,580 | $170,960 |
| 2015 | $2,736 | $225,970 | $61,580 | $164,390 |
| 2014 | -- | $216,760 | $61,580 | $155,180 |
| 2013 | -- | $216,760 | $61,580 | $155,180 |
Source: Public Records
Map
Nearby Homes
- 20248 Pugh Rd NE
- 20274 Pugh Rd NE
- 2496 NE Ariel Ct
- 2776 NE Noll Valley Loop
- 2416 NE Dynasty Dr
- 123 Pugh Rd NE
- 20165 Bue Rund Loop NE
- 19680 Noll Rd NE
- 1343 Lena Place NE
- 19370 NE Larson Ct
- 1257 Cameo Ct NE
- 1754 NE Mesford Rd Unit 12
- 1754 NE Mesford Rd Unit 28
- 19663 Rosebud Place NE
- 1330 NE Watland St
- 19226 Sandvik Place NE
- 0 Bond Rd NE
- 456 Little Valley Rd NE
- 20249 State Highway 305 NE
- 20050 Vikings Crest Loop NE Unit 2-301
- 20206 Valmore Ave NE
- 2936 NE Spartan Ct
- 2948 NE Spartan Ct
- 2949 NE Spartan Ct
- 2943 NE Spartan Ct
- 2937 NE Winesap Ct
- 2943 NE Winesap Ct
- 2937 NE Spartan Ct
- 20212 Valmore Ave NE
- 2955 NE Spartan Ct
- 2924 NE Spartan Ct
- 20207 Valmore Ave NE
- 20201 Valmore Ave NE
- 2931 NE Spartan Ct
- 2961 NE Spartan Ct
- 20213 Valmore Ave NE
- 2949 NE Winesap Ct
- 2925 NE Spartan Ct
- 20219 Valmore Ave NE
- 2915 NE Winesap Ct