2942 Springbluff Ln Unit 15 Buford, GA 30519
Estimated Value: $921,000 - $1,258,000
6
Beds
6
Baths
7,543
Sq Ft
$151/Sq Ft
Est. Value
About This Home
This home is located at 2942 Springbluff Ln Unit 15, Buford, GA 30519 and is currently estimated at $1,139,191, approximately $151 per square foot. 2942 Springbluff Ln Unit 15 is a home located in Gwinnett County with nearby schools including Patrick Elementary School, Glenn C. Jones Middle School, and Oak Hill Classical School.
Ownership History
Date
Name
Owned For
Owner Type
Purchase Details
Closed on
Aug 13, 2018
Sold by
Claude-Coeur Jean
Bought by
Newby Terry Leroy and Thomas-Newby Ruth
Current Estimated Value
Home Financials for this Owner
Home Financials are based on the most recent Mortgage that was taken out on this home.
Original Mortgage
$453,000
Outstanding Balance
$393,412
Interest Rate
4.5%
Estimated Equity
$745,779
Purchase Details
Closed on
Oct 18, 2016
Sold by
Jean-Baptiste Yves
Bought by
Claude Coeur Jean
Purchase Details
Closed on
Jun 29, 2007
Sold by
Goldmine Properties Inc
Bought by
Jean-Baptiste Yves
Home Financials for this Owner
Home Financials are based on the most recent Mortgage that was taken out on this home.
Original Mortgage
$510,000
Interest Rate
7.75%
Mortgage Type
New Conventional
Purchase Details
Closed on
Nov 4, 2005
Sold by
Oakbrook Communities Llc
Bought by
Goldmine Properties Inc
Create a Home Valuation Report for This Property
The Home Valuation Report is an in-depth analysis detailing your home's value as well as a comparison with similar homes in the area
Home Values in the Area
Average Home Value in this Area
Purchase History
| Date | Buyer | Sale Price | Title Company |
|---|---|---|---|
| Newby Terry Leroy | $470,000 | -- | |
| Claude Coeur Jean | -- | -- | |
| Jean-Baptiste Yves | $765,700 | -- | |
| Goldmine Properties Inc | $118,900 | -- |
Source: Public Records
Mortgage History
| Date | Status | Borrower | Loan Amount |
|---|---|---|---|
| Open | Newby Terry Leroy | $453,000 | |
| Previous Owner | Jean-Baptiste Yves | $510,000 |
Source: Public Records
Tax History Compared to Growth
Tax History
| Year | Tax Paid | Tax Assessment Tax Assessment Total Assessment is a certain percentage of the fair market value that is determined by local assessors to be the total taxable value of land and additions on the property. | Land | Improvement |
|---|---|---|---|---|
| 2024 | $4,113 | $448,360 | $76,000 | $372,360 |
| 2023 | $4,113 | $366,760 | $60,800 | $305,960 |
| 2022 | $4,074 | $366,760 | $60,800 | $305,960 |
| 2021 | $4,067 | $265,760 | $48,400 | $217,360 |
| 2020 | $2,921 | $188,000 | $48,400 | $139,600 |
| 2019 | $2,672 | $188,000 | $48,400 | $139,600 |
| 2018 | $9,658 | $265,760 | $48,400 | $217,360 |
| 2016 | $8,882 | $243,360 | $44,000 | $199,360 |
| 2015 | $8,387 | $226,240 | $35,600 | $190,640 |
| 2014 | $9,251 | $249,080 | $35,600 | $213,480 |
Source: Public Records
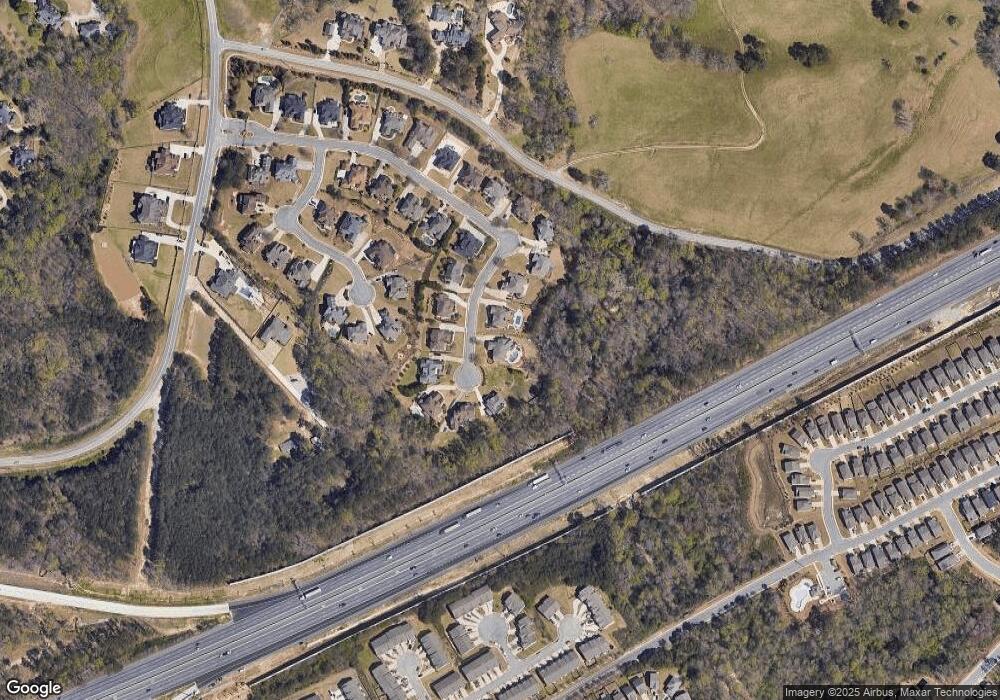
Map
Nearby Homes
- 2655 Camp Branch Rd
- 2729 Morgan Glen Rd
- 2508 Morgan Chase Dr
- 2500 Morgan Chase Dr
- 3009 Morgan Spring Trail
- 3049 Morgan Spring Trail
- 2760 Camp Branch Rd
- 2299 Misty Ivy Ct
- 2802 Nettle Ln
- 2805 Ivy Hill Dr
- 2253 Hansford Pass
- 2256 Hansford Pass
- 2233 Hansford Pass
- 2340 Cain Cir
- 2841 Trailing Ivy Way
- 2557 Woodford Ln
- 3227 Ivy Lake Ct
- 2942 Springbluff Ln
- 2962 Springbluff Ln
- 2943 Springbluff Ln
- 2912 Springbluff Ln
- 2933 Springbluff Ln
- 2973 Springbluff Ln
- 2963 Springbluff Ln
- 2902 Springbluff Ln
- 2923 Springbluff Ln Unit 22
- 2923 Springbluff Ln
- 2605 Springbluff Ct
- 2605 Springbluff Ct
- 2873 Springbluff Ln
- 2615 Springbluff Ct
- 2892 Springbluff Ln Unit 11
- 2892 Springbluff Ln
- 2610 Springbluff Ct
- 2863 Springbluff Ln
- 2882 Springbluff Ln
- 2625 Springbluff Ct