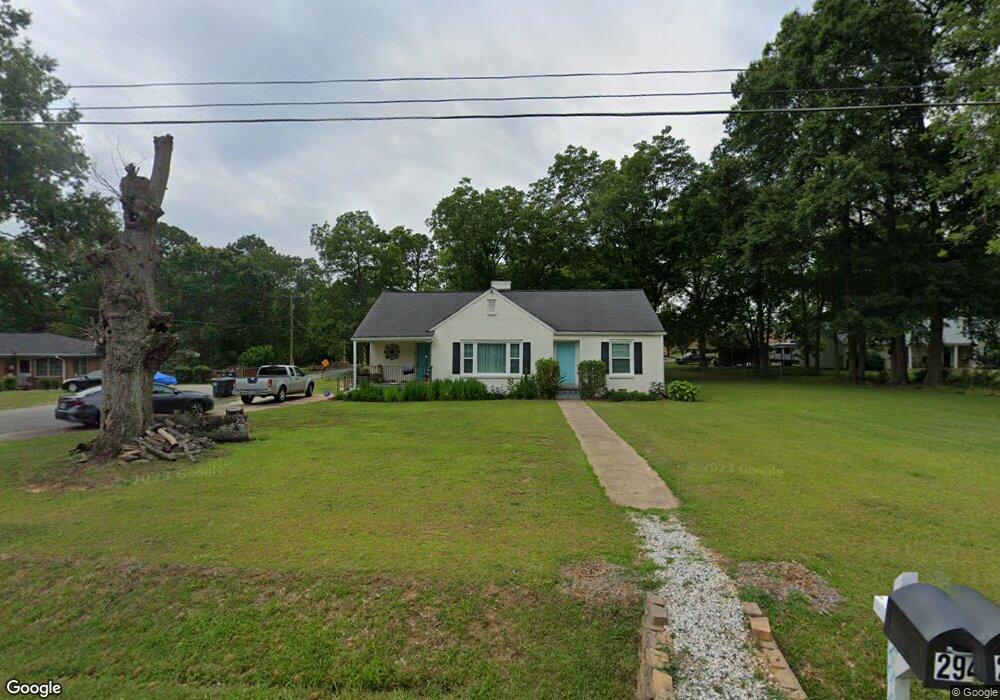
2942 State Highway 11 Mansfield, GA 30055
Estimated Value: $253,490 - $332,000
3
Beds
2
Baths
1,634
Sq Ft
$177/Sq Ft
Est. Value
About This Home
This home is located at 2942 State Highway 11, Mansfield, GA 30055 and is currently estimated at $289,123, approximately $176 per square foot. 2942 State Highway 11 is a home located in Newton County with nearby schools including Mansfield Elementary School, Indian Creek Middle School, and Eastside High School.
Ownership History
Date
Name
Owned For
Owner Type
Purchase Details
Closed on
Jan 23, 2015
Sold by
Rogers James H
Bought by
Miller Erika and Miller Andrew
Current Estimated Value
Home Financials for this Owner
Home Financials are based on the most recent Mortgage that was taken out on this home.
Original Mortgage
$87,125
Outstanding Balance
$66,494
Interest Rate
3.9%
Mortgage Type
New Conventional
Estimated Equity
$222,629
Purchase Details
Closed on
Apr 6, 2011
Sold by
Herring Bobby
Bought by
Rogers James H and Rogers Beth
Home Financials for this Owner
Home Financials are based on the most recent Mortgage that was taken out on this home.
Original Mortgage
$95,000
Interest Rate
4.92%
Mortgage Type
Trade
Purchase Details
Closed on
Nov 4, 2010
Sold by
Federal Natl Mtg Assn Fnma
Bought by
Herring Bobby
Purchase Details
Closed on
Sep 7, 2010
Sold by
Bank Of America
Bought by
Federal Natl Mtg Assn Fnma
Create a Home Valuation Report for This Property
The Home Valuation Report is an in-depth analysis detailing your home's value as well as a comparison with similar homes in the area
Home Values in the Area
Average Home Value in this Area
Purchase History
| Date | Buyer | Sale Price | Title Company |
|---|---|---|---|
| Miller Erika | $102,500 | -- | |
| Rogers James H | $100,000 | -- | |
| Herring Bobby | -- | -- | |
| Federal Natl Mtg Assn Fnma | -- | -- | |
| Bank Of America | $21,200 | -- |
Source: Public Records
Mortgage History
| Date | Status | Borrower | Loan Amount |
|---|---|---|---|
| Open | Miller Erika | $87,125 | |
| Previous Owner | Rogers James H | $95,000 |
Source: Public Records
Tax History Compared to Growth
Tax History
| Year | Tax Paid | Tax Assessment Tax Assessment Total Assessment is a certain percentage of the fair market value that is determined by local assessors to be the total taxable value of land and additions on the property. | Land | Improvement |
|---|---|---|---|---|
| 2025 | $2,624 | $102,080 | $16,400 | $85,680 |
| 2024 | $2,540 | $94,480 | $16,400 | $78,080 |
| 2023 | $2,398 | $83,000 | $8,200 | $74,800 |
| 2022 | $2,109 | $81,600 | $8,200 | $73,400 |
| 2021 | $1,790 | $62,920 | $8,200 | $54,720 |
| 2020 | $1,639 | $52,680 | $8,200 | $44,480 |
| 2019 | $1,652 | $52,320 | $8,200 | $44,120 |
| 2018 | $1,462 | $46,480 | $8,200 | $38,280 |
| 2017 | $1,316 | $42,240 | $8,200 | $34,040 |
| 2016 | $1,090 | $35,640 | $3,200 | $32,440 |
| 2015 | $602 | $21,440 | $3,200 | $18,240 |
| 2014 | $602 | $21,440 | $0 | $0 |
Source: Public Records
Map
Nearby Homes
- 2912 Highway 11 S
- 3009 Georgia 11
- 1042 Woodlawn Rd
- 2080 Georgia 11
- 280 Loyd Rd
- 290 Loyd Rd
- 402 Savannah Dr
- 3215 Highway 213
- 132 Loyd Rd
- 160 Loyd Rd
- 3001 Highway 213
- 172 Loyd Rd
- 184 Loyd Rd
- 200 Loyd Rd
- 105 Brookhollow Way
- 0 Wisteria Ln Unit TRACT 1 10561208
- 123 Nelson St
- 20 Wood Lawn Springs Trail
- 20 Woodlawn Springs Trail
- 0 Georgia 142 Unit 7572403
- 2942 Highway 11 S
- 2942 Main St Hwy 11
- N N Main St
- 0 N Main St Unit 38 Ac 8578129
- 224 White St
- 2950 Highway 11 S
- 2956 Highway 142
- 2931 Highway 11 S
- 2951 Highway 11 S
- 2921 Highway 11 S
- 2965 Highway 11 S
- 151 White St
- 201 White St
- 2913 Highway 11 S
- 251 White St
- 110 Pine St
- 2979 Highway 11 S
- 301 White St
- 2901 Highway 11 S
- 2866 Highway 11 S