Estimated Value: $384,235 - $447,000
3
Beds
1
Bath
1,120
Sq Ft
$373/Sq Ft
Est. Value
About This Home
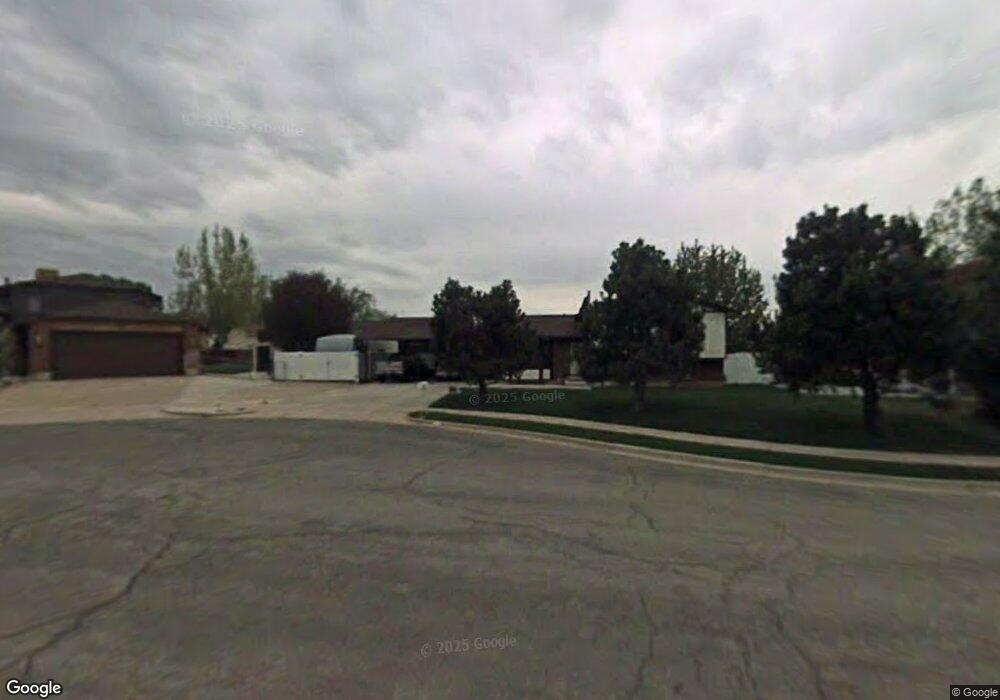
This home is located at 2943 W 4390 S, Roy, UT 84067 and is currently estimated at $417,809, approximately $373 per square foot. 2943 W 4390 S is a home located in Weber County with nearby schools including Midland School, Sand Ridge Junior High School, and Roy High School.
Ownership History
Date
Name
Owned For
Owner Type
Purchase Details
Closed on
Mar 25, 2003
Sold by
Vandenberg Jerry A
Bought by
Vandenberg Jerry A
Current Estimated Value
Home Financials for this Owner
Home Financials are based on the most recent Mortgage that was taken out on this home.
Original Mortgage
$108,000
Interest Rate
5.79%
Mortgage Type
Purchase Money Mortgage
Purchase Details
Closed on
Mar 24, 2003
Sold by
Vandenberg Jerry A and Vandenberg Vickie
Bought by
Vandenberg Jerry A
Home Financials for this Owner
Home Financials are based on the most recent Mortgage that was taken out on this home.
Original Mortgage
$108,000
Interest Rate
5.79%
Mortgage Type
Purchase Money Mortgage
Purchase Details
Closed on
Jun 1, 2001
Sold by
Vandenberg Jerry A
Bought by
Vandenberg Jerry A and Vandenberg Vickie
Purchase Details
Closed on
Aug 26, 1997
Sold by
Vandenberg Annie K
Bought by
Vandenberg Jerry A
Home Financials for this Owner
Home Financials are based on the most recent Mortgage that was taken out on this home.
Original Mortgage
$62,000
Interest Rate
7.43%
Mortgage Type
Purchase Money Mortgage
Create a Home Valuation Report for This Property
The Home Valuation Report is an in-depth analysis detailing your home's value as well as a comparison with similar homes in the area
Home Values in the Area
Average Home Value in this Area
Purchase History
| Date | Buyer | Sale Price | Title Company |
|---|---|---|---|
| Vandenberg Jerry A | -- | -- | |
| Vandenberg Jerry A | -- | -- | |
| Vandenberg Jerry A | -- | -- | |
| Vandenberg Jerry A | -- | -- |
Source: Public Records
Mortgage History
| Date | Status | Borrower | Loan Amount |
|---|---|---|---|
| Closed | Vandenberg Jerry A | $108,000 | |
| Closed | Vandenberg Jerry A | $62,000 |
Source: Public Records
Tax History Compared to Growth
Tax History
| Year | Tax Paid | Tax Assessment Tax Assessment Total Assessment is a certain percentage of the fair market value that is determined by local assessors to be the total taxable value of land and additions on the property. | Land | Improvement |
|---|---|---|---|---|
| 2025 | $2,418 | $379,829 | $140,295 | $239,534 |
| 2024 | $2,364 | $374,000 | $140,308 | $233,692 |
| 2023 | $2,380 | $379,000 | $132,063 | $246,937 |
| 2022 | $2,308 | $207,350 | $61,766 | $145,584 |
| 2021 | $1,889 | $278,000 | $77,323 | $200,677 |
| 2020 | $1,835 | $249,000 | $77,323 | $171,677 |
| 2019 | $1,715 | $218,000 | $51,830 | $166,170 |
| 2018 | $1,611 | $192,000 | $46,848 | $145,152 |
| 2017 | $1,509 | $168,000 | $44,899 | $123,101 |
| 2016 | $1,450 | $86,704 | $22,469 | $64,235 |
| 2015 | $1,262 | $76,196 | $22,469 | $53,727 |
| 2014 | $1,273 | $76,196 | $22,469 | $53,727 |
Source: Public Records
Map
Nearby Homes
- 2979 W 4275 S
- 2816 W 4400 S
- 4445 S 2750 W
- 2802 W 4375 S
- 4635 S 2950 W
- 4553 Trailside Dr
- 2777 W 4175 S Unit 229
- 4440 Stone Creek Rd Unit 2E
- 2781 W 4140 S Unit 239
- 2642 W 4400 S
- 4510 Stone Creek Rd Unit F
- 3171 W 4725 S
- 4491 Haven Creek Rd Unit A
- 4317 S 3350 W
- 4155 Westlake Dr
- 4022 S 2725 W
- 2917 W 3970 S Unit 53
- 4736 S 2675 W
- 4118 Westlake Dr
- 3963 S 2900 W Unit 2B