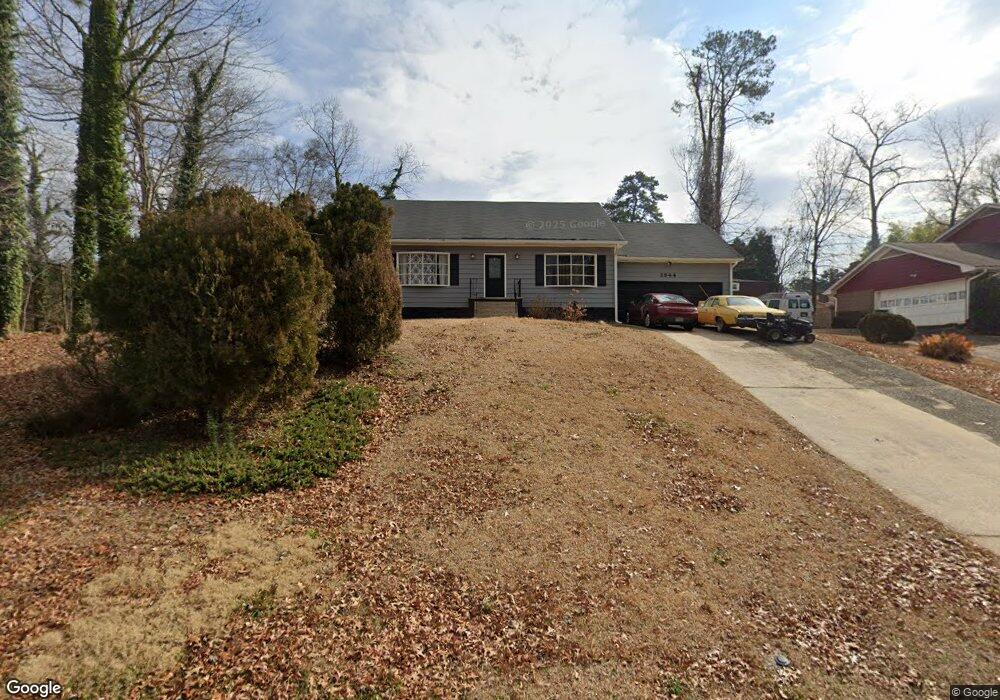
2944 Pheasant Dr Decatur, GA 30034
Southwest DeKalb NeighborhoodEstimated Value: $314,000 - $389,000
4
Beds
3
Baths
2,828
Sq Ft
$119/Sq Ft
Est. Value
About This Home
This home is located at 2944 Pheasant Dr, Decatur, GA 30034 and is currently estimated at $336,749, approximately $119 per square foot. 2944 Pheasant Dr is a home located in DeKalb County with nearby schools including Rainbow Elementary School, Chapel Hill Middle School, and Southwest Dekalb High School.
Ownership History
Date
Name
Owned For
Owner Type
Purchase Details
Closed on
Dec 22, 2012
Sold by
Hicks Herbert
Bought by
Hicks Omar
Current Estimated Value
Purchase Details
Closed on
Jan 14, 2008
Sold by
Cwabs 04-Ab2
Bought by
Hicks Herbert L and Hicks Marilyn V
Home Financials for this Owner
Home Financials are based on the most recent Mortgage that was taken out on this home.
Original Mortgage
$83,250
Interest Rate
6.12%
Mortgage Type
New Conventional
Purchase Details
Closed on
Apr 3, 2007
Sold by
Sanders Kimberly M
Bought by
Bank Of New York 04-Ab2
Purchase Details
Closed on
Oct 31, 2003
Sold by
Lowery Georgia C
Bought by
Mcleish Richard A
Home Financials for this Owner
Home Financials are based on the most recent Mortgage that was taken out on this home.
Original Mortgage
$87,000
Interest Rate
5.93%
Mortgage Type
New Conventional
Purchase Details
Closed on
Sep 30, 1998
Sold by
Steele Oscar J and Steele Mary A
Bought by
Lowery Georgia C
Home Financials for this Owner
Home Financials are based on the most recent Mortgage that was taken out on this home.
Original Mortgage
$122,955
Interest Rate
6.76%
Mortgage Type
FHA
Create a Home Valuation Report for This Property
The Home Valuation Report is an in-depth analysis detailing your home's value as well as a comparison with similar homes in the area
Home Values in the Area
Average Home Value in this Area
Purchase History
| Date | Buyer | Sale Price | Title Company |
|---|---|---|---|
| Hicks Omar | $50,000 | -- | |
| Hicks Herbert L | $92,500 | -- | |
| Bank Of New York 04-Ab2 | $130,106 | -- | |
| Mcleish Richard A | $87,000 | -- | |
| Lowery Georgia C | $125,000 | -- |
Source: Public Records
Mortgage History
| Date | Status | Borrower | Loan Amount |
|---|---|---|---|
| Previous Owner | Hicks Herbert L | $83,250 | |
| Previous Owner | Mcleish Richard A | $87,000 | |
| Previous Owner | Lowery Georgia C | $122,955 |
Source: Public Records
Tax History Compared to Growth
Tax History
| Year | Tax Paid | Tax Assessment Tax Assessment Total Assessment is a certain percentage of the fair market value that is determined by local assessors to be the total taxable value of land and additions on the property. | Land | Improvement |
|---|---|---|---|---|
| 2025 | $571 | $128,520 | $16,000 | $112,520 |
| 2024 | $949 | $140,760 | $16,000 | $124,760 |
| 2023 | $949 | $84,320 | $8,000 | $76,320 |
| 2022 | $353 | $80,760 | $8,000 | $72,760 |
| 2021 | $353 | $67,840 | $8,000 | $59,840 |
| 2020 | $353 | $63,480 | $8,000 | $55,480 |
| 2019 | $353 | $79,400 | $8,000 | $71,400 |
| 2018 | $2,126 | $54,920 | $4,200 | $50,720 |
| 2017 | $353 | $40,000 | $4,400 | $35,600 |
| 2016 | $1,855 | $40,000 | $4,200 | $35,800 |
| 2014 | $1,589 | $27,280 | $4,200 | $23,080 |
Source: Public Records
Map
Nearby Homes
- 3470 Albatross Ct
- 3457 Newberry Trail
- 3664 Preakness Dr
- 3498 Newberry Trail
- 2977 Cascade Manor Dr
- 3648 Calumet Rd
- 3640 Freda Ct Unit 2
- 2810 Knollview Dr
- 3696 Calumet Rd
- 3063 Kerr Dr
- 3109 Albatross Ln
- 2824 Tralyn Ct
- 3729 Citation Dr
- 2738 Rainbow Ridge Rd
- 3114 Springside Crossing
- 3519 Calumet Rd
- 2713 Knollview Dr
- 3766 Citation Dr
- 2703 Rainbow Forest Dr
- 3689 Laurie Woods Ln
- 2952 Pheasant Dr
- 2949 Blue Grass Ln
- 2957 Blue Grass Ln
- 2941 Blue Grass Ln Unit 4
- 2928 Pheasant Dr
- 2960 Pheasant Dr
- 3504 Columbia Pkwy
- 2953 Pheasant Dr
- 2965 Blue Grass Ln
- 2937 Pheasant Dr
- 2933 Blue Grass Ln Unit 4
- 2945 Pheasant Dr
- 2920 Pheasant Dr
- 2961 Pheasant Dr
- 2971 Blue Grass Ln
- 2921 Pheasant Dr
- 2925 Blue Grass Ln
- 3579 Preakness Dr
- 2940 Blue Grass Ln Unit 4
- 2990 Pheasant Dr