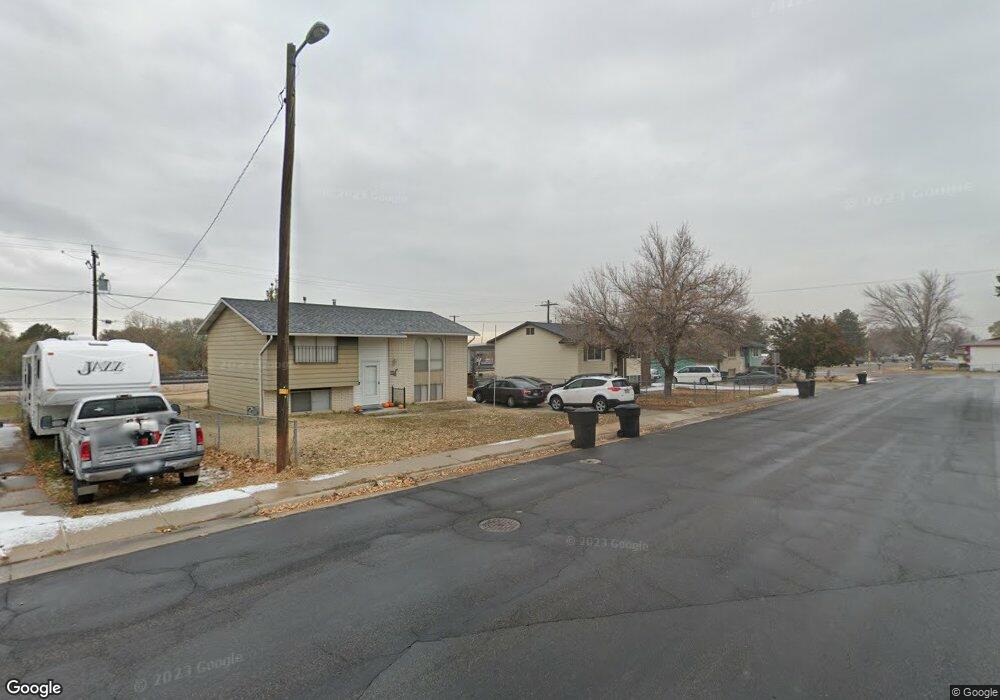
2944 W 2250 N Clearfield, UT 84015
Estimated Value: $487,314 - $539,000
5
Beds
3
Baths
2,455
Sq Ft
$213/Sq Ft
Est. Value
About This Home
This home is located at 2944 W 2250 N, Clearfield, UT 84015 and is currently estimated at $522,079, approximately $212 per square foot. 2944 W 2250 N is a home located in Davis County with nearby schools including West Clinton Elementary School, West Point Junior High School, and Clearfield High School.
Ownership History
Date
Name
Owned For
Owner Type
Purchase Details
Closed on
Jun 26, 2007
Sold by
Hirst James S and Hirst Sandra B
Bought by
Boscosky Michael R
Current Estimated Value
Home Financials for this Owner
Home Financials are based on the most recent Mortgage that was taken out on this home.
Original Mortgage
$25,000
Outstanding Balance
$3,616
Interest Rate
6.21%
Mortgage Type
Credit Line Revolving
Estimated Equity
$518,463
Purchase Details
Closed on
Sep 18, 2000
Sold by
Woodside Homes Corp
Bought by
Hirst James S and Hirst Sandra B
Home Financials for this Owner
Home Financials are based on the most recent Mortgage that was taken out on this home.
Original Mortgage
$119,550
Interest Rate
8.07%
Create a Home Valuation Report for This Property
The Home Valuation Report is an in-depth analysis detailing your home's value as well as a comparison with similar homes in the area
Home Values in the Area
Average Home Value in this Area
Purchase History
| Date | Buyer | Sale Price | Title Company |
|---|---|---|---|
| Boscosky Michael R | -- | First American Title | |
| Hirst James S | -- | First American Title Co |
Source: Public Records
Mortgage History
| Date | Status | Borrower | Loan Amount |
|---|---|---|---|
| Open | Boscosky Michael R | $25,000 | |
| Open | Boscosky Michael R | $173,520 | |
| Previous Owner | Hirst James S | $119,550 |
Source: Public Records
Tax History
| Year | Tax Paid | Tax Assessment Tax Assessment Total Assessment is a certain percentage of the fair market value that is determined by local assessors to be the total taxable value of land and additions on the property. | Land | Improvement |
|---|---|---|---|---|
| 2025 | $2,603 | $250,251 | $108,191 | $142,060 |
| 2024 | $2,629 | $254,099 | $116,934 | $137,165 |
| 2023 | $2,399 | $235,950 | $75,099 | $160,850 |
| 2022 | $2,602 | $468,000 | $144,174 | $323,826 |
| 2021 | $2,364 | $347,000 | $106,486 | $240,514 |
| 2020 | $2,079 | $302,000 | $94,529 | $207,471 |
| 2019 | $2,008 | $285,000 | $103,059 | $181,941 |
| 2018 | $1,851 | $258,000 | $86,120 | $171,880 |
| 2016 | $1,625 | $116,985 | $34,345 | $82,640 |
| 2015 | $1,610 | $110,165 | $34,345 | $75,820 |
| 2014 | $1,564 | $108,741 | $34,345 | $74,396 |
| 2013 | -- | $106,771 | $30,425 | $76,346 |
Source: Public Records
Map
Nearby Homes
- 339 N 3250 W Unit 12
- 3027 W 2600 N
- 2679 W 2500 N
- 3233 W 2500 N
- 2434 N Eurasian Crane Rd
- 3016 W 2650 N
- 3359 W Eurasian Crane Rd
- 2542 N 3300 W
- 2219 N 2475 W
- 3941 W 1800 N
- 2216 N 3430 W
- 4144 W 6075 S
- 4264 W 6025 S
- 2091 N 3430 W
- 2434 W 2250 N
- 2449 N Sarus Crane Dr
- 1926 N 2530 W
- 2119 N 2360 W
- 2118 Snowy Crane Dr
- 2493 W 1850 N
Your Personal Tour Guide
Ask me questions while you tour the home.