
2945 Byrnwyck W Maumee, OH 43537
Estimated payment $2,722/month
Highlights
- Popular Property
- Deck
- Walk-In Pantry
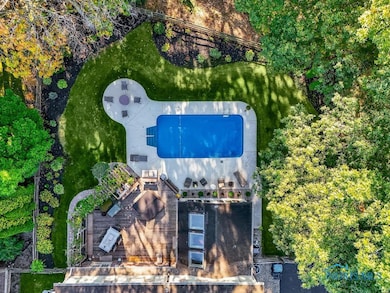
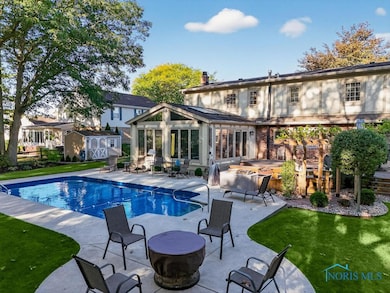
- In Ground Pool
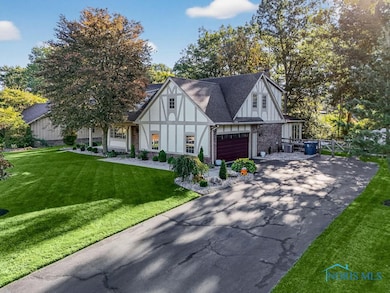
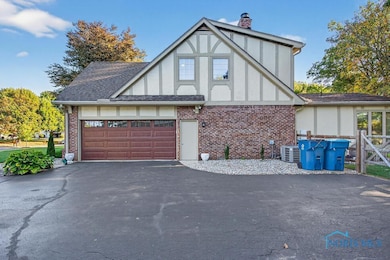
- Tudor Architecture
- Shed
About This Home
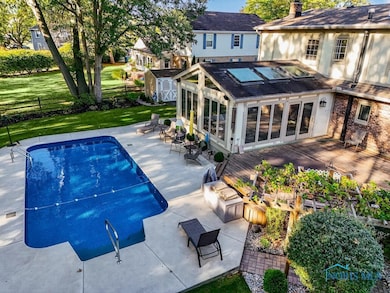
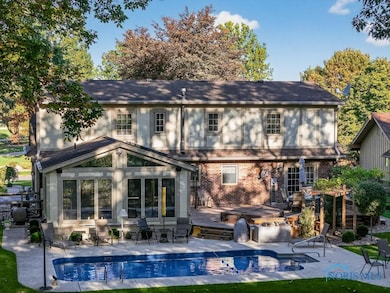
Nestled in the sought-after Brandywine Country Club community, this 4 bedroom 2.5 bath home has 3,038 sqft of living space. Updated landscaping w/river rock adds curb appeal. Inside features oak hardwood floors, a family room with wood-burning fireplace, and a kitchen remodeled 4 yrs ago with custom cabinets, quartz counters & walk-in pantry. Large sunroom offers a sauna & wet bar with views of the backyard. Relax by the 14x28 in-ground heated salt water pool (4 yrs old), built in hot tub, and patio. Back yard is fenced and has a storage shed. Other major updates include new furnace & AC 5 years ago. Spacious bedrooms, updated half bath, and prime location near golf, dining, & shopping.
Home Details
Home Type
- Single Family
Est. Annual Taxes
- $3,571
Year Built
- Built in 1974
Parking
- 2 Car Garage
- Driveway
- Off-Street Parking
Home Design
- Tudor Architecture
- Brick Exterior Construction
- Shingle Roof
- Stucco
Interior Spaces
- 3,038 Sq Ft Home
- 2-Story Property
- Wood Burning Fireplace
- Family Room with Fireplace
- Carpet
- Partial Basement
Kitchen
- Walk-In Pantry
- Microwave
- Dishwasher
- Disposal
Bedrooms and Bathrooms
- 4 Bedrooms
Laundry
- Dryer
- Washer
Outdoor Features
- In Ground Pool
- Deck
- Shed
Schools
- Monclova Elementary School
- Anthony Wayne High School
Utilities
- Forced Air Heating and Cooling System
- Heating System Uses Natural Gas
- Water Heater
Additional Features
- 0.45 Acre Lot
- Property is near a golf course
Community Details
- Byrnwyck Subdivision
Listing and Financial Details
- Assessor Parcel Number 38-47771
Map
Home Values in the Area
Average Home Value in this Area
Tax History
| Year | Tax Paid | Tax Assessment Tax Assessment Total Assessment is a certain percentage of the fair market value that is determined by local assessors to be the total taxable value of land and additions on the property. | Land | Improvement |
|---|---|---|---|---|
| 2024 | $3,571 | $139,895 | $24,920 | $114,975 |
| 2023 | $5,371 | $93,660 | $18,900 | $74,760 |
| 2022 | $5,400 | $93,660 | $18,900 | $74,760 |
| 2021 | $5,291 | $93,660 | $18,900 | $74,760 |
| 2020 | $5,196 | $82,495 | $16,310 | $66,185 |
| 2019 | $5,048 | $82,495 | $16,310 | $66,185 |
| 2018 | $4,649 | $82,495 | $16,310 | $66,185 |
| 2017 | $4,506 | $69,615 | $14,420 | $55,195 |
| 2016 | $4,462 | $198,900 | $41,200 | $157,700 |
| 2015 | $4,274 | $198,900 | $41,200 | $157,700 |
| 2014 | $4,177 | $67,590 | $14,000 | $53,590 |
| 2013 | $4,177 | $67,590 | $14,000 | $53,590 |
Property History
| Date | Event | Price | List to Sale | Price per Sq Ft |
|---|---|---|---|---|
| 11/07/2025 11/07/25 | Price Changed | $459,900 | -1.1% | $151 / Sq Ft |
| 10/30/2025 10/30/25 | Price Changed | $464,900 | -0.9% | $153 / Sq Ft |
| 10/21/2025 10/21/25 | Price Changed | $469,000 | -1.3% | $154 / Sq Ft |
| 10/17/2025 10/17/25 | Price Changed | $475,000 | -3.0% | $156 / Sq Ft |
| 10/15/2025 10/15/25 | Off Market | $489,900 | -- | -- |
| 10/14/2025 10/14/25 | For Sale | $489,900 | 0.0% | $161 / Sq Ft |
| 10/07/2025 10/07/25 | Price Changed | $489,900 | -2.0% | $161 / Sq Ft |
| 10/03/2025 10/03/25 | For Sale | $499,900 | -- | $165 / Sq Ft |
Purchase History
| Date | Type | Sale Price | Title Company |
|---|---|---|---|
| Warranty Deed | $215,000 | Attorney | |
| Limited Warranty Deed | $258,000 | None Available | |
| Interfamily Deed Transfer | -- | -- |
Mortgage History
| Date | Status | Loan Amount | Loan Type |
|---|---|---|---|
| Open | $151,000 | New Conventional | |
| Previous Owner | $206,400 | Purchase Money Mortgage |
Source: Northwest Ohio Real Estate Information Service (NORIS)
MLS Number: 6136241
APN: 38-47771
Disclaimer: Certain information contained herein is derived from information provided by parties other than Homes.com. All information provided is deemed reliable, but is not guaranteed to be accurate and should be independently verified.
![]() IDX information is provided exclusively for personal, non-commercial use, and may not be used for any purpose other than to identify prospective properties consumers may be interested in purchasing. Information is deemed reliable but not guaranteed. ©2025 NORIS. All rights reserved.
IDX information is provided exclusively for personal, non-commercial use, and may not be used for any purpose other than to identify prospective properties consumers may be interested in purchasing. Information is deemed reliable but not guaranteed. ©2025 NORIS. All rights reserved.
- 6965 Fenwyck Rd Unit 6965
- 6818 Fenwyck Rd
- 6649 Mill Ridge Rd
- 6717 Embassy Ct Unit O57
- 6696 Embassy Ct Unit C11
- 7040 Country Creek Rd
- 6640 Salisbury Rd
- 3008 Pleasant Hill Rd
- 6661 Brick Yard Ct
- 6627 Embassy Ct Unit I38
- 6667 Echo Valley Ct
- 6652 Sue Ln
- 6705 Garden Rd Unit 6705
- 3360 Stillwater Blvd
- 7407 Lock Mill Ct
- 6608 W Meadows Ln
- 6602 W Meadows Ln
- 7439 Lock Mill Ct
- 120 William Grace Way
- 127 William Grace Way
- 6400 Salisbury Rd
- 6325 Garden Rd
- 6400 Glenhurst Dr
- 2423 S Holland Sylvania Rd
- 6853 Deer Ridge Rd
- 2611 Pine Trace Dr
- 7300 Nightingale Dr
- 5569 Ryewyck Ct
- 5560 Heatherdowns Blvd Unit 6
- 5507 Glenridge Dr
- 7000 Quail Lakes Dr W
- 6155 Trust Dr
- 4623 Lakeside Dr
- 1520 Market Place Dr
- 5987 Thunder Hollow Dr
- 1436 Picadilly Ln
- 1372 Picadilly Ln
- 2221 Foxbourne Rd
- 1736 Brownstone Blvd
- 5943 Walnut Cir
