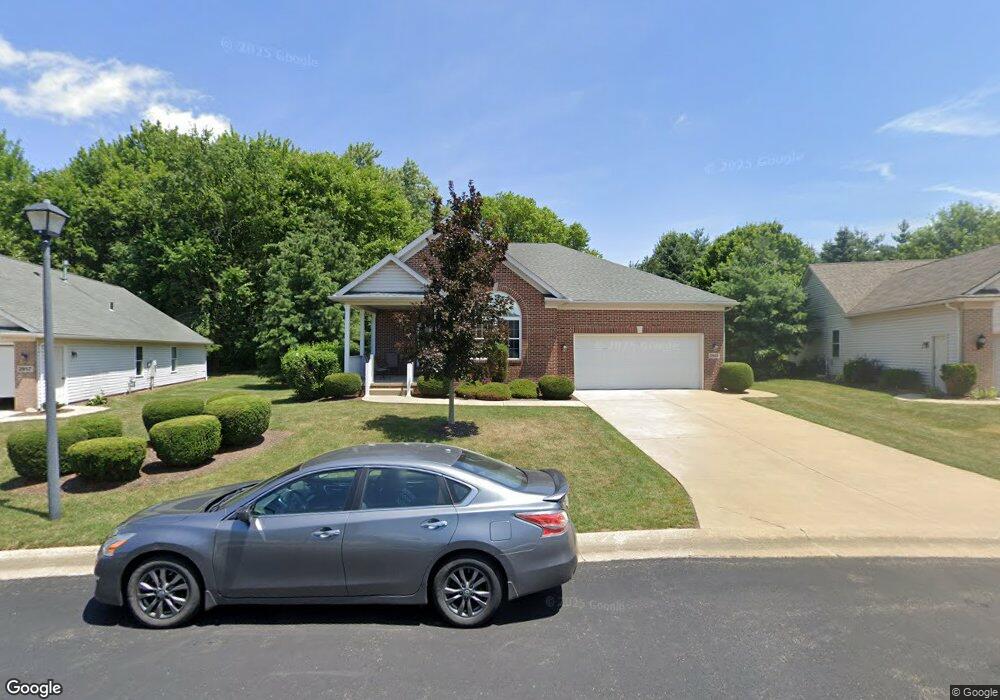
2945 Chalford Cir NW Unit 41 North Canton, OH 44720
Estimated Value: $353,000 - $373,000
2
Beds
3
Baths
2,022
Sq Ft
$179/Sq Ft
Est. Value
About This Home
This home is located at 2945 Chalford Cir NW Unit 41, North Canton, OH 44720 and is currently estimated at $362,764, approximately $179 per square foot. 2945 Chalford Cir NW Unit 41 is a home located in Stark County with nearby schools including North Canton Middle School, Hoover High School, and St Paul School.
Ownership History
Date
Name
Owned For
Owner Type
Purchase Details
Closed on
Jul 15, 2025
Sold by
Doris R Sterling Trust and Sterling Doris R
Bought by
Clifton G Dahlman Living Trust and Sharon E Dahlman Living Trust
Current Estimated Value
Purchase Details
Closed on
Aug 29, 2013
Sold by
Sterling Doris R
Bought by
Sterling Doris R and The Doris R Sterling Revocable
Purchase Details
Closed on
Apr 8, 2011
Sold by
Sterling Allan C and Sterling Doris R
Bought by
Sterling Allan C and Sterling Doris R
Purchase Details
Closed on
Nov 16, 2004
Sold by
Mckinley Development Co
Bought by
Sterling Allan C and Sterling Doris R
Home Financials for this Owner
Home Financials are based on the most recent Mortgage that was taken out on this home.
Original Mortgage
$100,000
Interest Rate
5.91%
Mortgage Type
Purchase Money Mortgage
Create a Home Valuation Report for This Property
The Home Valuation Report is an in-depth analysis detailing your home's value as well as a comparison with similar homes in the area
Home Values in the Area
Average Home Value in this Area
Purchase History
| Date | Buyer | Sale Price | Title Company |
|---|---|---|---|
| Clifton G Dahlman Living Trust | $349,500 | None Listed On Document | |
| Sterling Doris R | -- | None Available | |
| Sterling Allan C | -- | Attorney | |
| Sterling Allan C | $229,900 | -- |
Source: Public Records
Mortgage History
| Date | Status | Borrower | Loan Amount |
|---|---|---|---|
| Previous Owner | Sterling Allan C | $100,000 |
Source: Public Records
Tax History Compared to Growth
Tax History
| Year | Tax Paid | Tax Assessment Tax Assessment Total Assessment is a certain percentage of the fair market value that is determined by local assessors to be the total taxable value of land and additions on the property. | Land | Improvement |
|---|---|---|---|---|
| 2025 | -- | $129,850 | $21,910 | $107,940 |
| 2024 | -- | $129,850 | $21,910 | $107,940 |
| 2023 | $4,940 | $102,590 | $17,360 | $85,230 |
| 2022 | $4,759 | $102,590 | $17,360 | $85,230 |
| 2021 | $4,897 | $102,590 | $17,360 | $85,230 |
| 2020 | $4,805 | $92,860 | $16,630 | $76,230 |
| 2019 | $4,497 | $92,860 | $16,630 | $76,230 |
| 2018 | $4,659 | $92,860 | $16,630 | $76,230 |
| 2017 | $3,396 | $73,360 | $14,630 | $58,730 |
| 2016 | $3,409 | $73,360 | $14,630 | $58,730 |
| 2015 | $3,421 | $73,360 | $14,630 | $58,730 |
| 2014 | $1,463 | $70,670 | $14,460 | $56,210 |
| 2013 | $1,772 | $72,070 | $14,460 | $57,610 |
Source: Public Records
Map
Nearby Homes
- 3047 Chalford Cir NW Unit 46B
- 9520-9570 Cleveland Ave NW
- 2709 Country Squire St NW
- 9534 Garden Park Cir NW
- 3237 State St NW
- 8835 Blitzen Rd NW
- 3048 Wright Rd NW
- 8876 Blitzen Rd NW
- 10531 Newbury Ave NW
- 2840 Barclay Cir NW
- 8568 Mackenzie Ave NW
- 3622 Dotwood St NW
- 3278 Sumser St NW Unit 2
- 8510 Deacon Ave NW
- 8817 Pleasantwood Ave NW
- 8327 Cleveland Ave NW
- 8173 Spencer Ave NW
- 0 Rosewood Ave NW
- 8653 Rosewood Ave NW
- 8271 Pheasant Ave NW
- 2933 Chalford Cir NW
- 2957 Chalford Cir NW Unit 42
- 2969 Chalford Cir NW
- 2942 Chalford Cir NW Unit 54
- 2886 Shillingford Cir NW
- 2970 Chalford Cir NW Unit 53
- 2928 Chalford Cir NW Unit 55B
- 2884 Shillingford Cir NW
- 2985 Chalford Cir NW Unit 44
- 2926 Chalford Cir NW Unit 55A
- 2984 Chalford Cir NW Unit 52
- 2887 Shillingford Cir NW
- 2923 Chalford Cir NW
- 3025 Chalford Cir NW
- 9475 Huntshire Ave NW Unit 32
- 2992 Chalford Cir NW Unit 51
- 3096 Shillington
- 2870 Shillingford Cir NW
- 3049 Chalford Cir NW Unit 46A
- 2883 Shillingford Cir NW