Estimated Value: $4,100,000 - $4,332,788
7
Beds
12
Baths
18,065
Sq Ft
$232/Sq Ft
Est. Value
About This Home
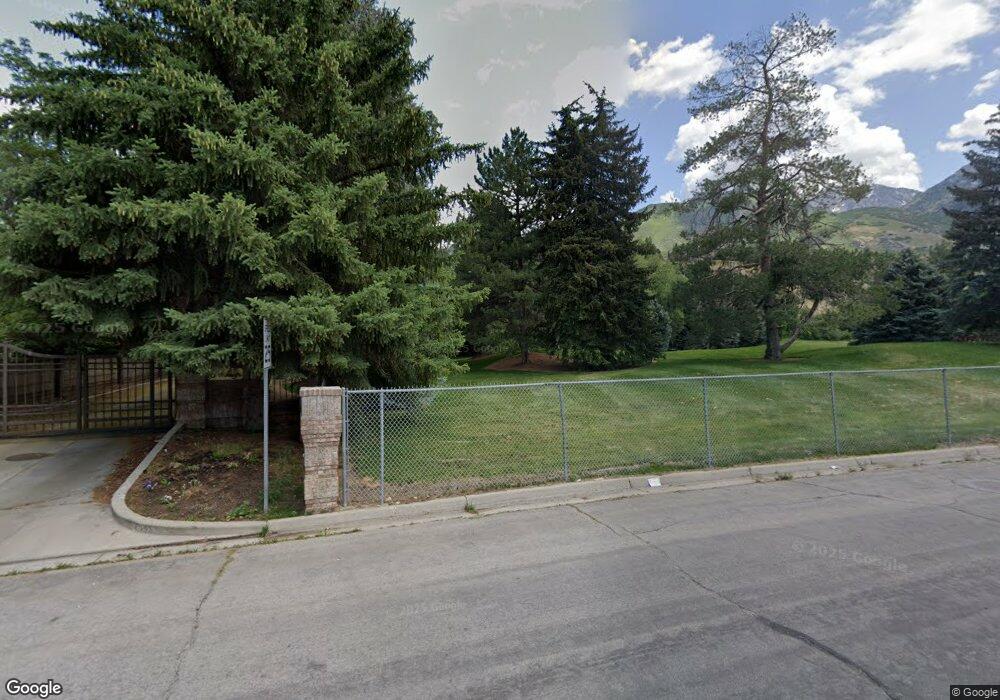
This home is located at 2945 E Robidoux Rd, Sandy, UT 84093 and is currently estimated at $4,183,929, approximately $231 per square foot. 2945 E Robidoux Rd is a home located in Salt Lake County with nearby schools including Brookwood Elementary School, Butler Middle School, and Brighton High School.
Ownership History
Date
Name
Owned For
Owner Type
Purchase Details
Closed on
Dec 13, 2024
Sold by
Tug Holdings Llc
Bought by
Lauren And Hyrum Kirton Family Compound Llc
Current Estimated Value
Purchase Details
Closed on
Jul 22, 2016
Sold by
Holding Peterson Anne
Bought by
Tug Holdings Llc
Purchase Details
Closed on
Aug 8, 2014
Sold by
Peterson Christian N and Holding Peterson Anne
Bought by
Holding Peterson Anne and The Anne Holding Peterson Trust
Purchase Details
Closed on
Jun 10, 2008
Sold by
Peterson Christian N and Holding Peterson Anne
Bought by
Island Lake Llc
Purchase Details
Closed on
Jul 12, 2005
Sold by
Peterson Christian N and Peterson Anne H
Bought by
Peterson Christian N and Holding Peterson Anne
Purchase Details
Closed on
Sep 25, 2002
Sold by
Peterson Anne Holding
Bought by
Peterson Christian N and Peterson Anne Holding
Purchase Details
Closed on
Dec 29, 1995
Sold by
Holding R E
Bought by
Peterson Anne Holding
Create a Home Valuation Report for This Property
The Home Valuation Report is an in-depth analysis detailing your home's value as well as a comparison with similar homes in the area
Home Values in the Area
Average Home Value in this Area
Purchase History
| Date | Buyer | Sale Price | Title Company |
|---|---|---|---|
| Lauren And Hyrum Kirton Family Compound Llc | -- | Highland Title | |
| Tug Holdings Llc | -- | Cottonwood Title | |
| Holding Peterson Anne | -- | None Available | |
| Island Lake Llc | -- | None Available | |
| Peterson Christian N | -- | -- | |
| Peterson Christian N | -- | -- | |
| Peterson Anne Holding | -- | -- |
Source: Public Records
Mortgage History
| Date | Status | Borrower | Loan Amount |
|---|---|---|---|
| Closed | Tug Holdings Llc | $0 |
Source: Public Records
Tax History
| Year | Tax Paid | Tax Assessment Tax Assessment Total Assessment is a certain percentage of the fair market value that is determined by local assessors to be the total taxable value of land and additions on the property. | Land | Improvement |
|---|---|---|---|---|
| 2025 | $33,305 | $4,230,890 | $942,090 | $3,288,800 |
| 2024 | $33,305 | $4,863,890 | $1,048,690 | $3,815,200 |
| 2023 | $33,305 | $5,125,390 | $1,344,600 | $3,780,790 |
| 2022 | $56,636 | $4,737,390 | $1,316,500 | $3,420,890 |
| 2021 | $41,417 | $3,039,600 | $1,071,400 | $1,968,200 |
| 2020 | $43,584 | $2,987,900 | $1,071,400 | $1,916,500 |
| 2019 | $44,276 | $3,019,790 | $1,046,400 | $1,973,390 |
| 2018 | $42,774 | $2,959,490 | $1,046,400 | $1,913,090 |
| 2017 | $44,980 | $3,052,190 | $1,046,400 | $2,005,790 |
| 2016 | $31,291 | $3,792,100 | $1,021,400 | $2,770,700 |
| 2015 | $81,263 | $3,325,100 | $963,400 | $2,361,700 |
| 2014 | -- | $5,553,700 | $1,467,300 | $4,086,400 |
Source: Public Records
Map
Nearby Homes
- 3132 E Nordic Dr
- 8179 Nordic Cir
- 8330 S Danish Rd
- 3075 E Creek Rd
- 3181 E Deer Cir
- 3261 E Lantern Hill Ct
- 3388 E Stonehill Ln
- 2614 E Tuxedo Cir
- 2591 E Creek Rd
- 2670 Bridger Blvd Unit 8
- 3269 E Germania Cir
- 8651 S Mount Majestic Rd
- 8597 Mount Majestic Rd
- 8585 Mount Majestic Rd
- 7970 S Grand Vista Way
- 7931 S Norwood Rd
- 8760 S Rustler Rd
- 2862 E Pamela Dr
- 3566 Wasatch Hills Ln
- 8778 S Falcon Heights Ln
- 2945 E Robidoux Rd
- 8255 S Ashley Cir
- 8255 Ashley Cir
- 8226 S Scandia Way
- 8226 S Scandia Way
- 8224 S Scandia Way
- 8263 S Ashley Cir
- 8263 Ashley Cir
- 3062 E Nordic Dr Unit 8B
- 8214 S Scandia Way Unit 10B
- 2965 Robidoux Rd
- 8216 S Scandia Way
- 8214 S Scandia Way
- 8214 S Scandia Way Unit 26
- 8202 S Scandia Way Unit 11A
- 3064 E Nordic Dr
- 3067 Timber Crest Cove
- 8251 S Ashley Cir
- 8251 S Ashley Cir
- 8200 S Scandia Way
Your Personal Tour Guide
Ask me questions while you tour the home.