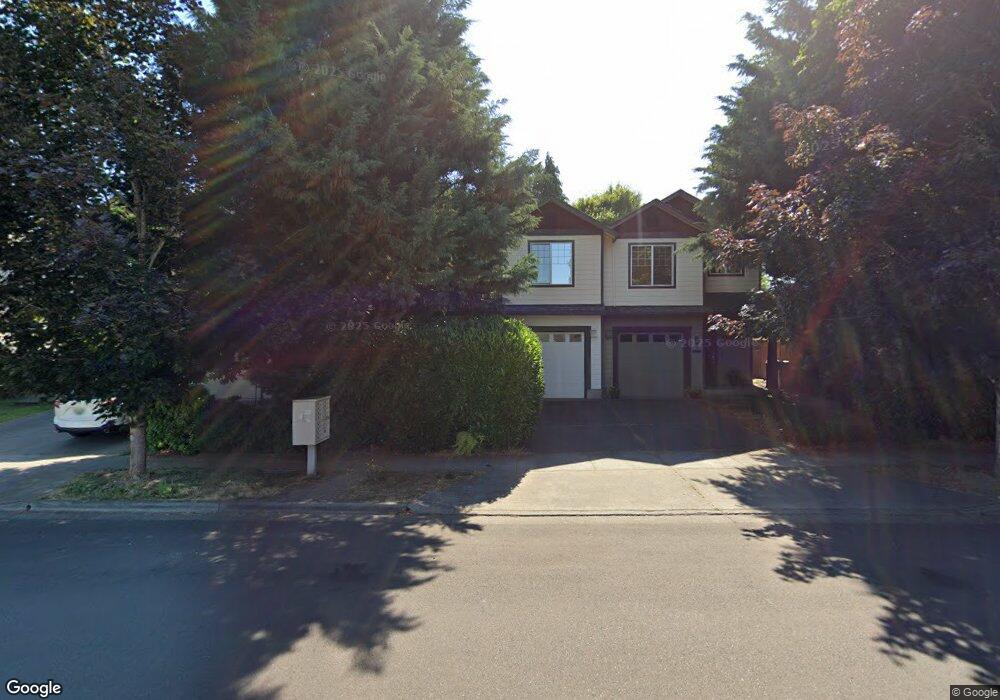
2945 Main St Forest Grove, OR 97116
Estimated Value: $342,000 - $388,000
3
Beds
3
Baths
1,385
Sq Ft
$270/Sq Ft
Est. Value
About This Home
This home is located at 2945 Main St, Forest Grove, OR 97116 and is currently estimated at $373,533, approximately $269 per square foot. 2945 Main St is a home located in Washington County with nearby schools including Harvey Clarke Elementary School, Tom McCall Upper Elementary School, and Neil Armstrong Middle School.
Ownership History
Date
Name
Owned For
Owner Type
Purchase Details
Closed on
Feb 10, 2020
Sold by
Hall Samuel J
Bought by
Hall Kelly D
Current Estimated Value
Home Financials for this Owner
Home Financials are based on the most recent Mortgage that was taken out on this home.
Original Mortgage
$230,000
Outstanding Balance
$202,778
Interest Rate
3.6%
Mortgage Type
New Conventional
Estimated Equity
$170,755
Purchase Details
Closed on
Oct 22, 2014
Sold by
Iburg Scott
Bought by
Hall Samuel J and Hall Kelly D
Home Financials for this Owner
Home Financials are based on the most recent Mortgage that was taken out on this home.
Original Mortgage
$195,918
Interest Rate
4.1%
Mortgage Type
New Conventional
Purchase Details
Closed on
Apr 8, 2009
Sold by
Laurkis Llc
Bought by
Iburg Scott
Home Financials for this Owner
Home Financials are based on the most recent Mortgage that was taken out on this home.
Original Mortgage
$50,000
Interest Rate
5.06%
Mortgage Type
Unknown
Create a Home Valuation Report for This Property
The Home Valuation Report is an in-depth analysis detailing your home's value as well as a comparison with similar homes in the area
Purchase History
| Date | Buyer | Sale Price | Title Company |
|---|---|---|---|
| Hall Kelly D | $22,500 | Wfg Title | |
| Hall Samuel J | $192,000 | First American | |
| Iburg Scott | $173,000 | Pacific Nw Title Of Or Inc |
Source: Public Records
Mortgage History
| Date | Status | Borrower | Loan Amount |
|---|---|---|---|
| Open | Hall Kelly D | $230,000 | |
| Previous Owner | Hall Samuel J | $195,918 | |
| Previous Owner | Iburg Scott | $50,000 |
Source: Public Records
Tax History
| Year | Tax Paid | Tax Assessment Tax Assessment Total Assessment is a certain percentage of the fair market value that is determined by local assessors to be the total taxable value of land and additions on the property. | Land | Improvement |
|---|---|---|---|---|
| 2026 | $4,058 | $227,850 | -- | -- |
| 2025 | $4,058 | $221,220 | -- | -- |
| 2024 | $3,914 | $214,780 | -- | -- |
| 2023 | $3,914 | $208,530 | $0 | $0 |
| 2022 | $3,423 | $208,530 | $0 | $0 |
| 2021 | $3,379 | $196,570 | $0 | $0 |
| 2020 | $3,360 | $190,850 | $0 | $0 |
| 2019 | $3,286 | $185,300 | $0 | $0 |
| 2018 | $3,185 | $179,910 | $0 | $0 |
| 2017 | $3,086 | $174,670 | $0 | $0 |
| 2016 | $3,000 | $169,590 | $0 | $0 |
| 2015 | $2,884 | $164,660 | $0 | $0 |
| 2014 | $2,871 | $159,870 | $0 | $0 |
Source: Public Records
Map
Nearby Homes
- 2106 Charlie Ct
- 2838 Charlie Ct
- 1926 27th Ave
- 2555 Bourbon St
- 2549 Bourbon St
- 2543 Bourbon St
- 2342 26th Ct
- 1636 Bonnie Ln
- 2032 Silverstone Dr
- 1960 Silverstone Dr
- 2443 26th Ave
- 2081 Silverstone Dr
- 1611 Camino Dr
- 2211 23rd Ave
- 1440 Alyssum Ave
- 2212 23rd Ave
- 2043 35th Ave
- 2091 35th Ave
- 1407 Willamina Ave
- 2149 36th Unit Lot 59
- 2937 Main St
- 2953 Main St
- 2961 Main St
- 2011 Willamina Ave
- 2969 Main St
- 2005 Willamina Ave
- 2977 Main St
- 2985 Main St
- 2019 Willamina Ave
- 2006 30th Ave
- 2916 Main St
- 1959 Willamina Ave
- 2993 Main St
- 1933 Willamina Ave
- 2012 30th Ave
- 2027 Willamina Ave
- 2924 Main St
- 3000 Main St Unit 58
- 2018 30th Ave
- 2010 Willamina Ave
Your Personal Tour Guide
Ask me questions while you tour the home.