


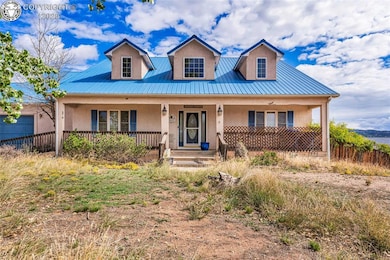

2945 Paw Prints Dr Canon City, CO 81212
Estimated payment $3,112/month
Total Views
46,327
3
Beds
2
Baths
2,876
Sq Ft
$191
Price per Sq Ft
Highlights
- 1 Acre Lot
- Double Oven
- Concrete Porch or Patio
- Ranch Style House
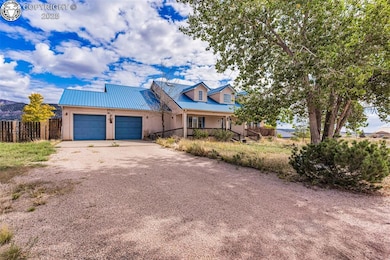
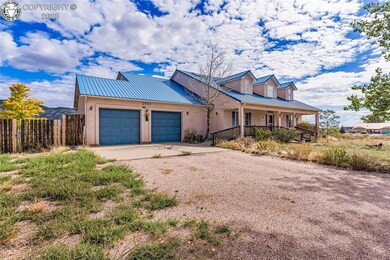
- 4 Car Attached Garage
- Forced Air Heating and Cooling System
About This Home
Don’t miss this amazing opportunity to restore a stunning custom home perched atop a quiet cul-de-sac in Canon City, overlooking the beautiful Garden Park Valley. This spacious home boasts an ideal floorplan, beginning with a warm wood entry that opens to a large family room with a unique peekaboo rock fireplace. To the left, a formal dining room with hardwood floors adds charm, while beyond the family room lies an expansive living area. The kitchen is a chef’s dream, custom designed with an oversized cooktop, custom wood vent, double oven, beautiful oak cabinetry, solid surface countertops, a huge double sink, ample prep space, pantry cabinet, and room for a full cooking team. Three oversized main-floor bedrooms are filled with natural light from large windows. The colossal master bedroom is a true retreat with a giant walk in closet and an attached master bath with a jetted tub, double sink, walk in shower and bidet. Skylights, pot shelves, and dormer windows enhance the home's character throughout.
The heated, unfinished basement offers over 2,800 sq ft of potential, perfect for storage or future living space. Foundation repairs have been completed (reports available), though cosmetic stucco cracks remain. The property also includes an oversized attached 2-car garage with two single doors, extra storage space, and backyard access. Additionally, a detached oversized 2-car garage offers 875 sq ft of parking and workspace, complete with workbenches, shelving, and street access through a large gate. All of this is situated on a full acre with a fenced rear yard, offering room to grow, play, or create your ideal outdoor retreat. Priced for you to bring your love and hard work to restore this incredible custom home back to its full glory!
Home Details
Home Type
- Single Family
Est. Annual Taxes
- $2,651
Year Built
- Built in 2003
Parking
- 4 Car Attached Garage
Home Design
- Ranch Style House
- Wood Frame Construction
- Stucco Exterior
Interior Spaces
- 2,876 Sq Ft Home
- Gas Fireplace
- Double Oven
- Basement
Bedrooms and Bathrooms
- 3 Bedrooms
- 2 Full Bathrooms
Schools
- Harrison K-8 Elementary School
Utilities
- Forced Air Heating and Cooling System
- Heating System Uses Natural Gas
Additional Features
- Concrete Porch or Patio
- 1 Acre Lot
Community Details
- The community has rules related to covenants
Listing and Financial Details
- Assessor Parcel Number 99504616
Matterport 3D Tour
Floorplans
Map
Create a Home Valuation Report for This Property
The Home Valuation Report is an in-depth analysis detailing your home's value as well as a comparison with similar homes in the area
Home Values in the Area
Average Home Value in this Area
Tax History
| Year | Tax Paid | Tax Assessment Tax Assessment Total Assessment is a certain percentage of the fair market value that is determined by local assessors to be the total taxable value of land and additions on the property. | Land | Improvement |
|---|---|---|---|---|
| 2024 | $2,651 | $40,949 | $0 | $0 |
| 2023 | $2,651 | $37,264 | $0 | $0 |
| 2022 | $2,445 | $35,757 | $0 | $0 |
| 2021 | $2,448 | $36,786 | $0 | $0 |
| 2020 | $1,787 | $28,908 | $0 | $0 |
| 2019 | $1,763 | $28,908 | $0 | $0 |
| 2018 | $1,525 | $25,530 | $0 | $0 |
| 2017 | $1,819 | $25,530 | $0 | $0 |
| 2016 | $1,355 | $26,970 | $0 | $0 |
| 2015 | $1,919 | $26,970 | $0 | $0 |
| 2012 | $1,806 | $26,657 | $2,388 | $24,269 |
Source: Public Records
Property History
| Date | Event | Price | List to Sale | Price per Sq Ft |
|---|---|---|---|---|
| 11/01/2025 11/01/25 | Price Changed | $550,000 | -3.5% | $191 / Sq Ft |
| 09/30/2025 09/30/25 | For Sale | $570,000 | -- | $198 / Sq Ft |
Source: Royal Gorge Association of REALTORS®
Purchase History
| Date | Type | Sale Price | Title Company |
|---|---|---|---|
| Quit Claim Deed | -- | None Listed On Document | |
| Quit Claim Deed | -- | None Listed On Document | |
| Deed | $328,000 | -- | |
| Deed | -- | -- | |
| Deed | $38,000 | -- | |
| Deed | $300,000 | -- | |
| Deed | -- | -- |
Source: Public Records
About the Listing Agent
Shelley has been involved in real estate her whole life. Her father practiced real estate and after she graduated college, she decided to follow in his footsteps. Shelley is licensed in multiple states and has worked in many types of markets. She used to type HUD contracts on a typewriter with carbon copy contracts (no mistakes allowed!). Shelley and her husband used to run a new construction company. They have bought and sold many homes and she has helped numerous families buy and sell homes.
Shelley's Other Listings
-
$365,000 Pending
- 3 Beds
- 2 Baths
- 1,568 Sq Ft
- 1337 York Ave
- Canon City, CO
Back on the market due to a failed contingent home sale, termination was not related to inspection or home. Charming log-sided single level home offering 3 spacious bedrooms, 2 full baths, and 1,568 sq ft of warm, inviting living space—all set on nearly an acre in the peaceful outskirts of Cañon City. Enjoy the best of country living with quick access to downtown amenities, schools, and outdoor
Shelley Keller HomeSmart Preferred Realty
-
$399,900
- 2 Beds
- 2 Baths
- 1,924 Sq Ft
- 401 Dozier Ave
- Canon City, CO
Step into this beautifully updated blend of cottage charm and farmhouse warmth. This inviting 2-bedroom, 2-bath home features an additional flexible space—perfect as a third bedroom, home office, or cozy den. Inside, you’ll find rich hardwood floors paired with sleek ceramic tile, hard surface countertops, and stylish finishes throughout. The kitchen is a showstopper with stainless steel
Shelley Keller HomeSmart Preferred Realty
-
$343,000 Pending
- 3 Beds
- 2 Baths
- 1,258 Sq Ft
- 723 Griffin Ave
- Canon City, CO
Discover this beautifully updated and energy-efficient 3-bedroom, 2-bath home perfectly situated in the heart of Cañon City. Just a few blocks from the vibrant historic downtown and within walking distance of the picturesque Arkansas Riverwalk, this home offers the ideal blend of charm, comfort, and convenience. Inside, you'll find a bright and welcoming layout anchored by a stunning, recently
Shelley Keller HomeSmart Preferred Realty
Source: Royal Gorge Association of REALTORS®
MLS Number: 4649035
APN: 000099504616
Disclaimer: Certain information contained herein is derived from information provided by parties other than Homes.com. All information provided is deemed reliable, but is not guaranteed to be accurate and should be independently verified.
![]() IDX information is provided exclusively for personal, non-commercial use, and may not be used for any purpose other than to identify prospective properties consumers may be interested in purchasing. Information is deemed reliable but not guaranteed.
IDX information is provided exclusively for personal, non-commercial use, and may not be used for any purpose other than to identify prospective properties consumers may be interested in purchasing. Information is deemed reliable but not guaranteed.
Nearby Homes
- 1256 Kendallwood Dr
- 3003 High St
- 1045 Field Ave
- tbd Rockafellow Ave
- 813 Keystone Loop
- 817 Keystone Loop
- 2200 Washington St
- 1284 Canon Ridge Trail
- 822 Keystone Loop
- 831 Robbie Ln
- 834 Keystone Loop
- 2795 Elizabeth St Unit 39
- 835 Juliana Ct
- tbd South St
- 0 Tbd St S
- 2150 Elizabeth St
- 827 N Raynolds Ave
- 1231 Lawrence St
- 888 N Orchard Ave Unit 22
- 888 N Orchard Ave Unit 15
- 353 N Raynolds Ave
- 726 W Tyrolean Ct
- 302 W El Paso Ave Unit 304
- 302 W El Paso Ave Unit 302
- 304 W El Paso Ave Unit 304
- 133 S Spaulding Ave
- 523 W Hook Dr
- 349 W Buttercup Way
- 6020 Buttermere Dr
- 333 W Concho Dr
- 325 E Main St Unit 3
- 325 E Main St Unit 12
- 5 Watch Hill Dr
- 18 Lea Ln
- 4075 Autumn Heights Dr Unit F
- 640 Wycliffe Dr
- 4125 Pebble Ridge Cir
- 905 Pacific Hills Point
- 4008 Westmeadow Dr
- 1735 Presidential Heights