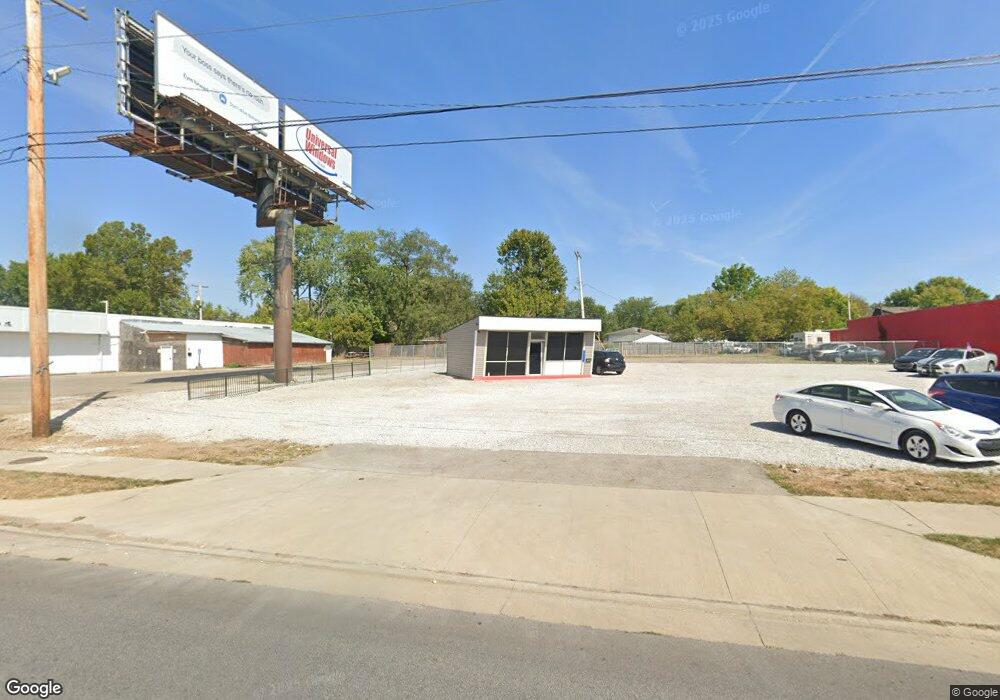
2946 Noe Bixby Rd Columbus, OH 43232
East Columbus-White Ash NeighborhoodEstimated Value: $447,534
--
Bed
--
Bath
400
Sq Ft
$1,119/Sq Ft
Est. Value
About This Home
This home is located at 2946 Noe Bixby Rd, Columbus, OH 43232 and is currently estimated at $447,534, approximately $1,118 per square foot. 2946 Noe Bixby Rd is a home located in Franklin County with nearby schools including Liberty Elementary School, Yorktown Middle School, and Independence High School.
Ownership History
Date
Name
Owned For
Owner Type
Purchase Details
Closed on
Sep 3, 2024
Sold by
Shalash Ibrahim
Bought by
Shalash Group Llc
Current Estimated Value
Purchase Details
Closed on
Sep 25, 2023
Sold by
Darazim Sujoud
Bought by
Shalash Ibrahim
Purchase Details
Closed on
Nov 5, 2021
Sold by
Franklin County Treasurer
Bought by
612 S Sandusky S
Purchase Details
Closed on
Oct 6, 2004
Sold by
Jallaq Ismail and 1775 E 5Th Ave Inc
Bought by
612 S Sandusky St Llc
Purchase Details
Closed on
Aug 22, 2003
Sold by
Otg 1 Llc
Bought by
1775 E 5Th Ave Inc
Purchase Details
Closed on
Jul 8, 1999
Sold by
Clark Oil & Refining Corp
Bought by
Otg 1 Llc
Purchase Details
Closed on
Jul 6, 1999
Sold by
Clark Oil & Refining Corp
Bought by
Otg 1 Llc
Purchase Details
Closed on
Dec 13, 1988
Bought by
Clark Oil & Refining Corp
Create a Home Valuation Report for This Property
The Home Valuation Report is an in-depth analysis detailing your home's value as well as a comparison with similar homes in the area
Home Values in the Area
Average Home Value in this Area
Purchase History
| Date | Buyer | Sale Price | Title Company |
|---|---|---|---|
| Shalash Group Llc | -- | None Listed On Document | |
| Shalash Ibrahim | $89,000 | None Listed On Document | |
| 612 S Sandusky S | -- | -- | |
| 612 S Sandusky St Llc | $70,000 | -- | |
| 1775 E 5Th Ave Inc | -- | Lawyers Title Eastwind | |
| Otg 1 Llc | -- | Transohio Title | |
| Otg 1 Llc | $156,200 | Transohio Title | |
| Clark Oil & Refining Corp | $87,900 | -- |
Source: Public Records
Tax History Compared to Growth
Tax History
| Year | Tax Paid | Tax Assessment Tax Assessment Total Assessment is a certain percentage of the fair market value that is determined by local assessors to be the total taxable value of land and additions on the property. | Land | Improvement |
|---|---|---|---|---|
| 2024 | $2,483 | $33,460 | $23,520 | $9,940 |
| 2023 | $2,421 | $33,460 | $23,520 | $9,940 |
| 2022 | $5,201 | $30,840 | $23,310 | $7,530 |
| 2021 | $2,552 | $30,840 | $23,310 | $7,530 |
| 2020 | $2,570 | $30,840 | $23,310 | $7,530 |
| 2019 | $2,415 | $28,010 | $21,180 | $6,830 |
| 2018 | $2,438 | $28,010 | $21,180 | $6,830 |
| 2017 | $1,999 | $28,010 | $21,180 | $6,830 |
| 2016 | $1,580 | $17,500 | $15,750 | $1,750 |
| 2015 | $2,467 | $27,830 | $21,180 | $6,650 |
| 2014 | $2,375 | $26,260 | $23,770 | $2,490 |
| 2013 | $1,046 | $26,250 | $23,765 | $2,485 |
Source: Public Records
Map
Nearby Homes
- 2900 Ronda Rd
- 2901 Renfro Rd
- 4847 Amber Crossing Dr
- 2746 Noe Bixby Rd
- 4784 Nieles Edge Dr
- 4783 Nieles Edge Dr
- 5125 Upton Rd N
- 4906 Refugee Rd
- 5152 Burdett Dr
- 5011 Refugee Rd
- 5323 Sundale Place S
- 2615 Carbondale Place
- 2998 Osgood Rd E
- 2342 Noe Bixby Rd
- 2336 Noe Bixby Rd
- 2360 Noe Bixby Rd
- 2354 Noe Bixby Rd
- 2348 Noe Bixby Rd
- 2150 Noe Bixby Rd
- 3246 Latonia Rd
- 2911 Ronda Rd
- 4933 Silverton Dr
- 4933 Silverton Dr
- 4976 Chatterton Rd
- 2907 Ronda Rd
- 2980 Noe Bixby Rd
- 4939 Silverton Dr
- 4901 Silverton Dr
- 2903 Ronda Rd
- 4909 Silverton Dr
- 4945 Silverton Dr
- 4917 Silverton Dr
- 4900 Silverton Dr
- 4906 Silverton Dr
- 2899 Ronda Rd
- 4912 Silverton Dr
- 4925 Silverton Dr
- 2908 Ronda Rd
- 4938 Silverton Dr
- 4920 Silverton Dr