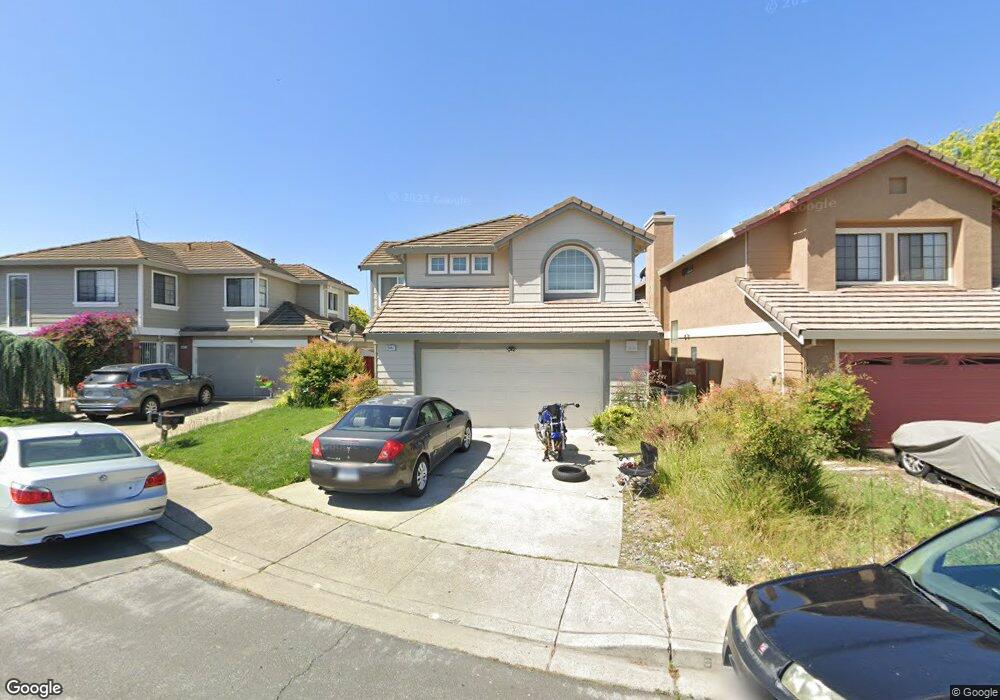
29467 Sal Ct Hayward, CA 94544
Tennyson-Alquire NeighborhoodEstimated Value: $1,067,000 - $1,138,000
About This Home
This home is located at 29467 Sal Ct, Hayward, CA 94544 and is currently estimated at $1,096,682, approximately $583 per square foot. 29467 Sal Ct is a home located in Alameda County with nearby schools including Ruus Elementary School, Cesar Chavez Middle School, and Tennyson High School.
Ownership History
We collect this data history from publicly available records. To have your information removed, we recommend requesting removal directly through your county’s website.
Purchase Details
Home Financials for this Owner
Home Financials are based on the most recent Mortgage that was taken out on this home.Purchase Details
Home Values in the Area
Average Home Value in this Area
Purchase History
We collect this data history from publicly available records. To have your information removed, we recommend requesting removal directly through your county’s website.
| Date | Buyer | Sale Price | Title Company |
|---|---|---|---|
| -- | Fidelity National Title Co | ||
| $220,000 | Fidelity National Title Co | ||
| -- | First American Title |
Mortgage History
We collect this data history from publicly available records. To have your information removed, we recommend requesting removal directly through your county’s website.
| Date | Status | Borrower | Loan Amount |
|---|---|---|---|
| Open | $198,000 |
Tax History
We collect this data history from publicly available records. To have your information removed, we recommend requesting removal directly through your county’s website.
| Year | Tax Paid | Tax Assessment Tax Assessment Total Assessment is a certain percentage of the fair market value that is determined by local assessors to be the total taxable value of land and additions on the property. | Land | Improvement |
|---|---|---|---|---|
| 2025 | $4,455 | $351,288 | $107,486 | $250,802 |
| 2024 | $4,455 | $344,264 | $105,379 | $245,885 |
| 2023 | $4,388 | $344,378 | $103,313 | $241,065 |
| 2022 | $4,304 | $330,627 | $101,288 | $236,339 |
| 2021 | $4,268 | $324,007 | $99,302 | $231,705 |
| 2020 | $4,221 | $327,614 | $98,284 | $229,330 |
| 2019 | $4,252 | $321,193 | $96,358 | $224,835 |
| 2018 | $3,997 | $314,896 | $94,469 | $220,427 |
| 2017 | $3,907 | $308,723 | $92,617 | $216,106 |
| 2016 | $3,675 | $302,671 | $90,801 | $211,870 |
| 2015 | $3,603 | $298,125 | $89,437 | $208,688 |
| 2014 | $3,426 | $292,287 | $87,686 | $204,601 |
Map
- 29495 Dixon St
- 29143 Colorado Rd Unit 174
- 29273 Nantucket Way
- 260 Industrial Pkwy Unit 47
- 260 Industrial Pkwy Unit 38
- 29174 Verdi Rd Unit 26
- 603 Nomad Ct
- 604 Nomad Ct
- 608 Nomad Ct
- 605 Nomad Ct
- 609 Nomad Ct
- 29181 Dixon St
- 386 Rhythm Ln
- 385 Line St
- 325 Valle Vista Ave Unit 117
- 29300 Dixon St Unit 207
- 29300 Dixon St Unit 106
- 953 New England Village Dr Unit 340
- 411 Rhythm Ln
- 29354 Middleborough Way Unit 160
Ask me questions while you tour the home.