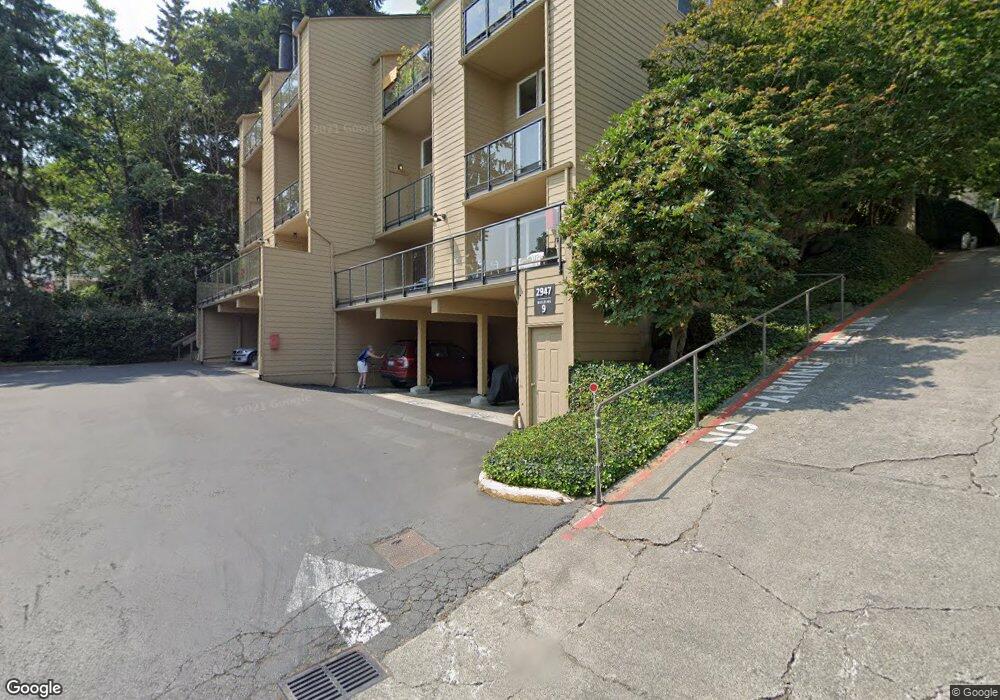
2947 76th Ave SE Unit 92D Mercer Island, WA 98040
Downtown Mercer Island NeighborhoodEstimated Value: $351,410 - $462,000
1
Bed
1
Bath
645
Sq Ft
$613/Sq Ft
Est. Value
About This Home
This home is located at 2947 76th Ave SE Unit 92D, Mercer Island, WA 98040 and is currently estimated at $395,353, approximately $612 per square foot. 2947 76th Ave SE Unit 92D is a home located in King County with nearby schools including West Mercer Elementary School, Islander Middle School, and Mercer Island High School.
Ownership History
Date
Name
Owned For
Owner Type
Purchase Details
Closed on
May 18, 2022
Sold by
Lam Hao V and Lam Lisa N
Bought by
Lam2022 Family Llc
Current Estimated Value
Purchase Details
Closed on
Nov 18, 2004
Sold by
Macaraig Marilyn J
Bought by
Lam Hao and Lam Lisa N
Home Financials for this Owner
Home Financials are based on the most recent Mortgage that was taken out on this home.
Original Mortgage
$130,000
Interest Rate
5.72%
Purchase Details
Closed on
Nov 14, 2002
Sold by
Macaraig Gaudencio L and Macaraig Janice E
Bought by
Macaraig Marilyn J
Home Financials for this Owner
Home Financials are based on the most recent Mortgage that was taken out on this home.
Original Mortgage
$65,000
Interest Rate
6.28%
Purchase Details
Closed on
Jun 5, 1992
Sold by
Linsenmayer Mark R
Bought by
Warkentin Jane D
Create a Home Valuation Report for This Property
The Home Valuation Report is an in-depth analysis detailing your home's value as well as a comparison with similar homes in the area
Home Values in the Area
Average Home Value in this Area
Purchase History
| Date | Buyer | Sale Price | Title Company |
|---|---|---|---|
| Lam2022 Family Llc | -- | None Listed On Document | |
| Lam Hao | $162,500 | Ticor National | |
| Macaraig Marilyn J | -- | Lawyers Title | |
| Warkentin Jane D | -- | -- |
Source: Public Records
Mortgage History
| Date | Status | Borrower | Loan Amount |
|---|---|---|---|
| Previous Owner | Lam Hao | $130,000 | |
| Previous Owner | Macaraig Marilyn J | $65,000 | |
| Closed | Macaraig Marilyn J | $30,000 |
Source: Public Records
Tax History Compared to Growth
Tax History
| Year | Tax Paid | Tax Assessment Tax Assessment Total Assessment is a certain percentage of the fair market value that is determined by local assessors to be the total taxable value of land and additions on the property. | Land | Improvement |
|---|---|---|---|---|
| 2024 | $2,584 | $392,000 | $95,100 | $296,900 |
| 2023 | $2,525 | $411,000 | $93,900 | $317,100 |
| 2022 | $2,490 | $409,000 | $91,500 | $317,500 |
| 2021 | $2,649 | $336,000 | $91,500 | $244,500 |
| 2020 | $2,709 | $329,000 | $91,500 | $237,500 |
| 2018 | $2,336 | $313,000 | $91,500 | $221,500 |
| 2017 | $1,753 | $268,000 | $91,500 | $176,500 |
| 2016 | $1,666 | $214,000 | $91,500 | $122,500 |
| 2015 | $1,569 | $198,000 | $91,500 | $106,500 |
| 2014 | -- | $178,000 | $89,100 | $88,900 |
| 2013 | -- | $142,000 | $89,100 | $52,900 |
Source: Public Records
Map
Nearby Homes
- 2949 76th Ave SE Unit 81D
- 2920 76th Ave SE Unit 411
- 7600 SE 29th St Unit A501
- 2965 74th Ave SE
- 7800 SE 27th St Unit 503
- 6950 SE Maker St
- 3204 81st Place SE Unit B202
- 28 XX 68th Ave SE
- 7929 SE 37th St
- 3639 W Mercer Way
- 2236 66th Ave SE
- 8428 N Mercer Way
- 3706 84th Ave SE
- 7254 N Mercer Way
- 4150 Boulevard Place
- 7220 N Mercer Way
- 3208 89th Place SE
- 4025 86th Ave SE
- 18 Holly Ln
- 8150 Evergreen Ln
- 2947 76th Ave SE Unit 92-C
- 2947 76th Ave SE Unit 92A
- 2947 76th Ave SE Unit 93-D
- 2947 76th Ave SE Unit 93C
- 2947 76th Ave SE Unit 93-A
- 2947 76th Ave SE Unit 92B
- 2947 76th Ave SE Unit 93B
- 2935 76th Ave SE Unit 22B
- 2935 76th Ave SE Unit 23B
- 2935 76th Ave SE
- 2935 76th Ave SE Unit 22A
- 2933 76th Ave SE
- 2933 76th Ave SE Unit 41C
- 2933 76th Ave SE Unit 92B
- 2933 76th Ave SE Unit 31A
- 2933 76th Ave SE Unit 23A
- 2933 76th Ave SE Unit 12E
- 2933 76th Ave SE Unit 12B
- 2933 76th Ave SE Unit 22B
- 2933 76th Ave SE Unit 93D